Fig. 7
Download original image
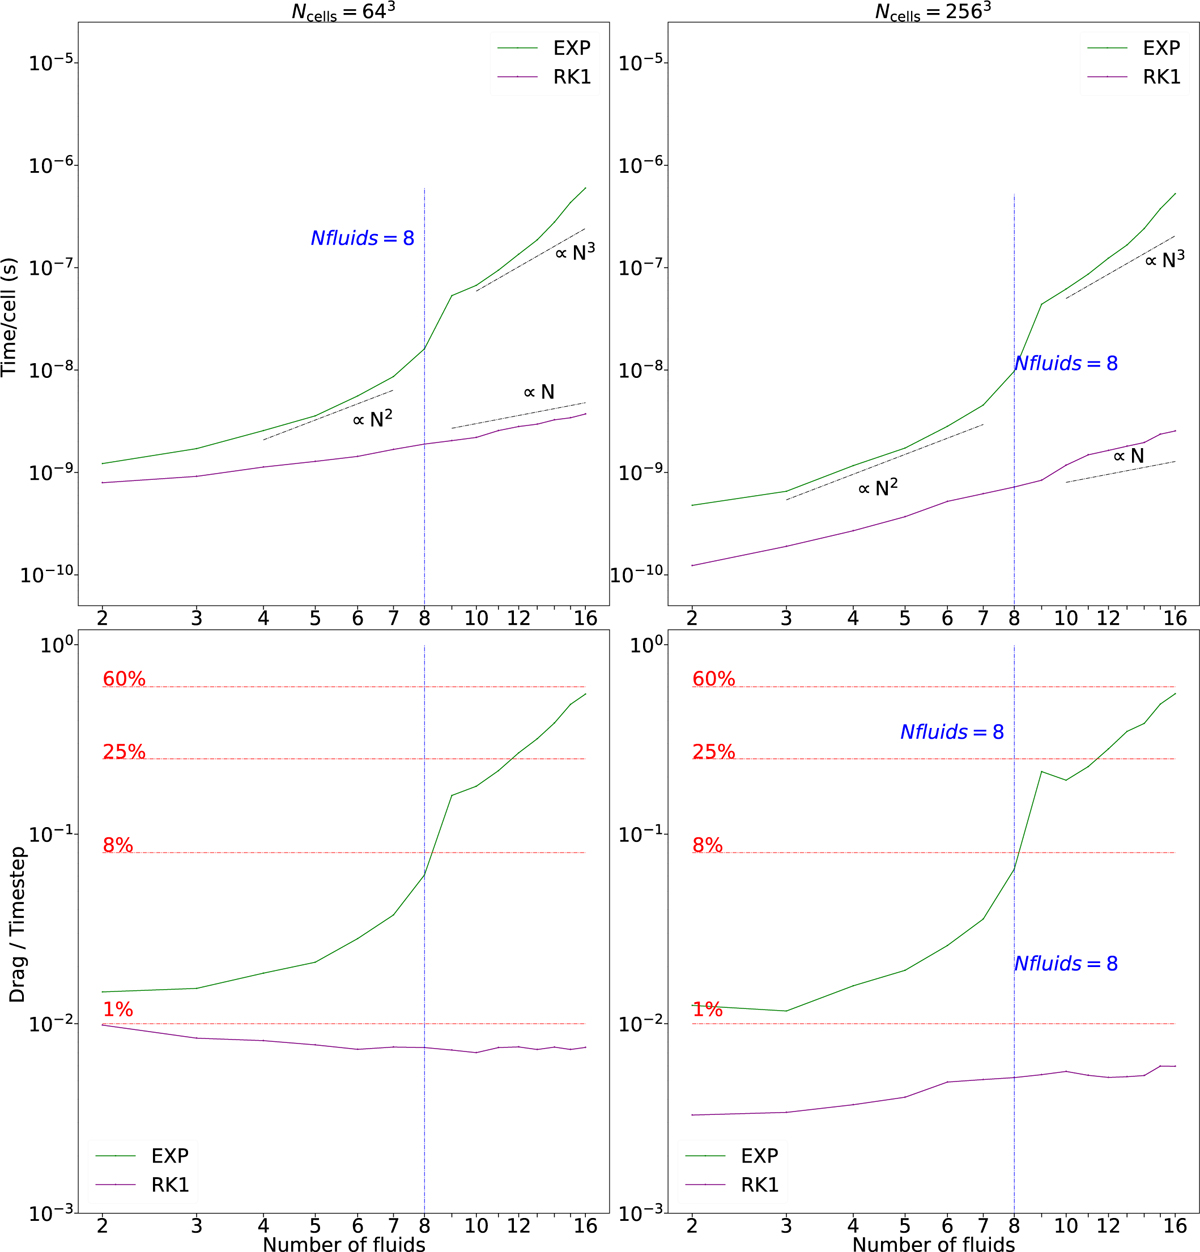
Performances of the EXP drag solver on a Dustywave test performed on a A100 GPU using Dyablo for Ncells=643 (left) and Ncells=2563 cells for 1 to 15 dust fluids, respectively. The top panels show the time per cell for the drag step. The bottom panels show the relative cost of the drag step with respect to the total time step (hydro+drag) per time step.
Current usage metrics show cumulative count of Article Views (full-text article views including HTML views, PDF and ePub downloads, according to the available data) and Abstracts Views on Vision4Press platform.
Data correspond to usage on the plateform after 2015. The current usage metrics is available 48-96 hours after online publication and is updated daily on week days.
Initial download of the metrics may take a while.