Fig. 1.
Download original image
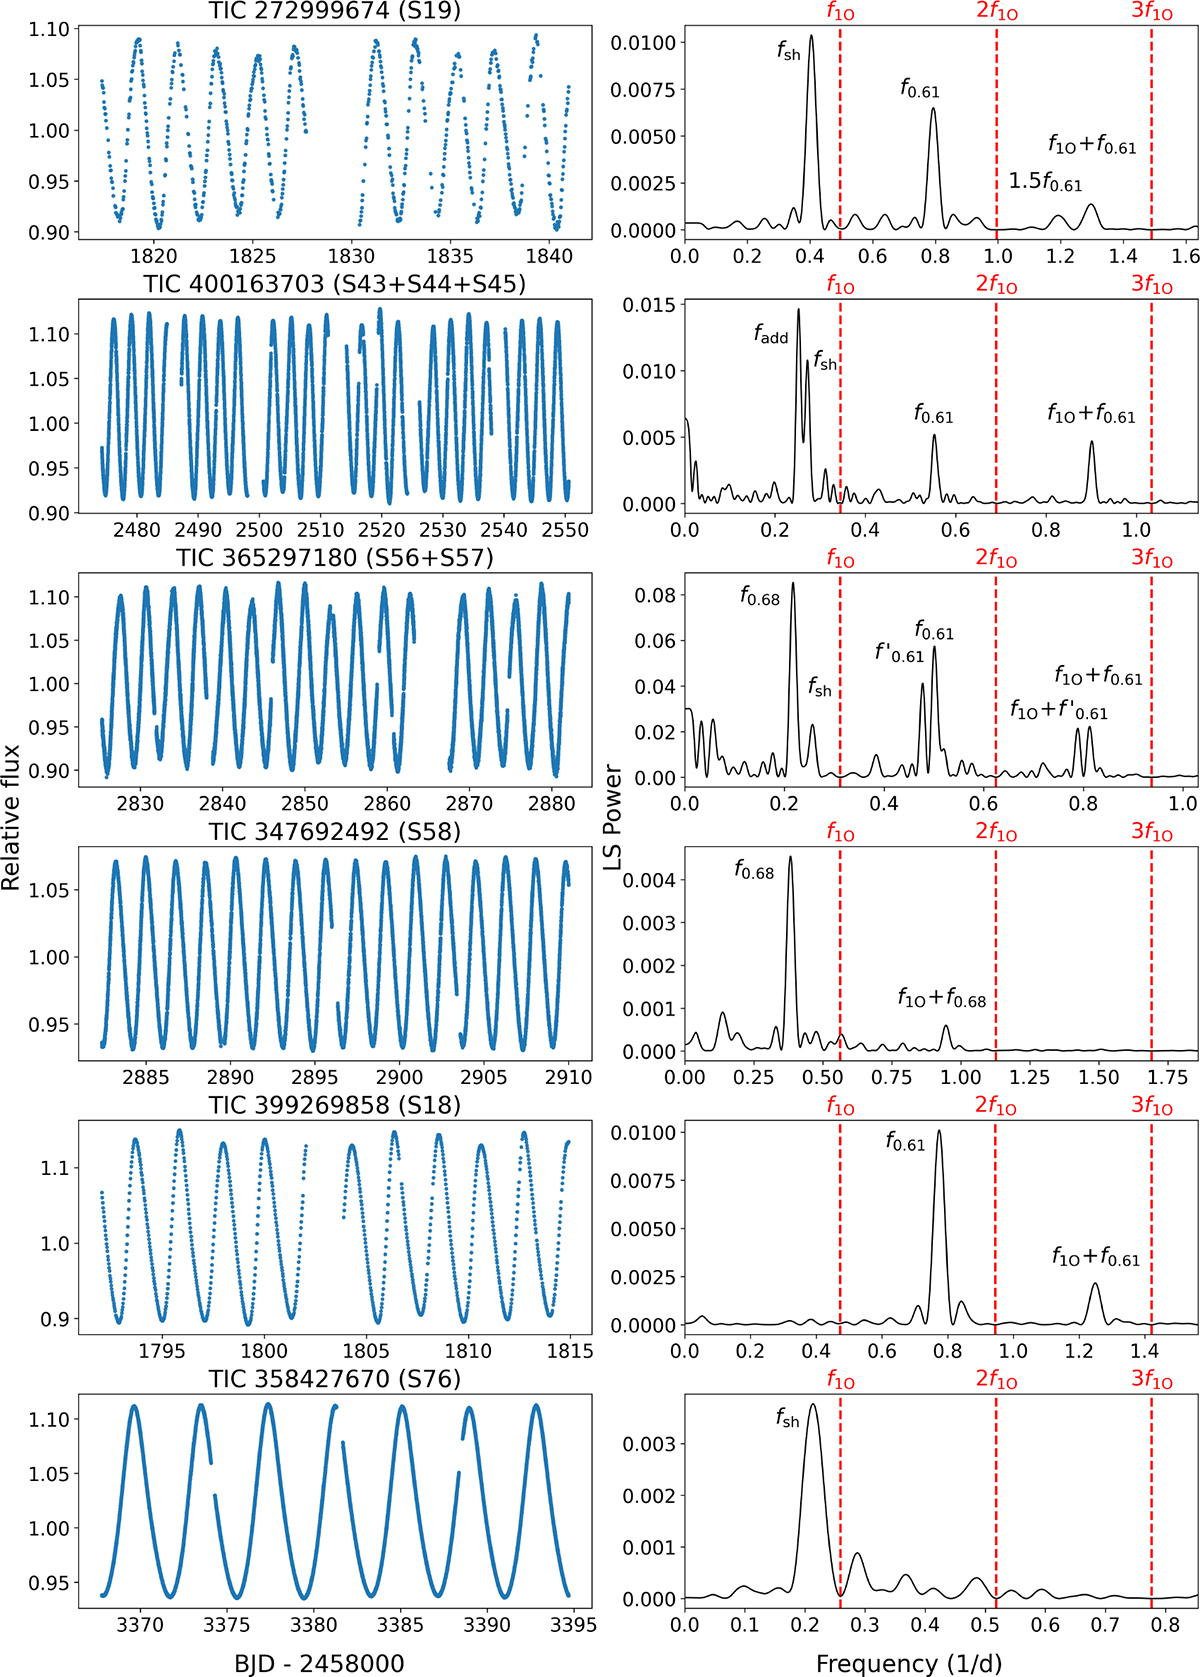
Example TESS QLP light curves and residual spectra for Cepheids with additional signals. Note that the frequency ranges in the right panels are different. Dashed red lines mark the positions of the subtracted frequencies of the first overtone mode (f1O, 2f1O, 3f1O). The low-amplitude peaks identified are labeled. fsh denotes the subharmonic frequency of the f0.61 peak.
Current usage metrics show cumulative count of Article Views (full-text article views including HTML views, PDF and ePub downloads, according to the available data) and Abstracts Views on Vision4Press platform.
Data correspond to usage on the plateform after 2015. The current usage metrics is available 48-96 hours after online publication and is updated daily on week days.
Initial download of the metrics may take a while.