| Issue |
A&A
Volume 703, November 2025
|
|
|---|---|---|
| Article Number | A155 | |
| Number of page(s) | 11 | |
| Section | Stellar structure and evolution | |
| DOI | https://doi.org/10.1051/0004-6361/202556557 | |
| Published online | 17 November 2025 | |
Exploring low-amplitude variability in first-overtone Cepheids with TESS
1
Konkoly Observatory, HUN-REN Research Centre for Astronomy and Earth Sciences, MTA Centre of Excellence, Konkoly Thege Miklós út 15-17., 1121 Budapest, Hungary
2
Nicolaus Copernicus Astronomical Center, Bartycka 18, 00-716 Warsaw, Poland
3
Department of Astrophysical Sciences, Princeton University Peyton Hall, 4 Ivy Lane, Princeton, NJ 08544, USA
⋆ Corresponding author: This email address is being protected from spambots. You need JavaScript enabled to view it.
Received:
23
July
2025
Accepted:
2
October
2025
Abstract
Context. Classical Cepheid stars that pulsate in the first overtone radial mode often exhibit additional periodicities at the millimagnitude level. Extensive studies of the OGLE data of the Magellanic Clouds have revealed distinct groups based on the ratio of the star’s additional period to the period of the first overtone mode. These groups are similar to those found in overtone RR Lyrae stars. Theoretical calculations suggest that some of the observed periodicities are consistent with non-radial modes, while others remain unexplained. Currently, we only know of a handful of examples from the Galactic Cepheid sample that exhibit low-amplitude periodicities.
Aims. The purpose of this study is to undertake a systematic search for low-amplitude variability in overtone Cepheids of the Milky Way in the photometric data of the full-frame images of the Transiting Exoplanet Survey Satellite (TESS), which were produced with the MIT Quick Look Pipeline.
Methods. We applied standard Fourier analysis and classified the additional signals according to the ratio of their period to the overtone pulsation period.
Results. We find 127 stars in total that exhibit additional periodicities. In 17 of these stars, the periodicities can be identified as a second radial overtone. A further 83 of the stars were observed to display periodic signals with a Px/P1O ratio in the range 0.60–0.65. In 15 stars, the P1O/Px is found to be ∼0.68; six of these stars are also found to be in the previous group. Furthermore, we observed the presence of low-amplitude signals in 22 stars outside the aforementioned period ratio ranges. It is possible that some are direct detections of non-radial modes, with no harmonic frequency peak in the 0.60–0.65 period range.
Conclusions. Most of the properties of the additional signals detected in this study are consistent with previous findings regarding Cepheids in the Magellanic Clouds. However, TESS measurements reveal that the amplitudes and frequencies of these signals often vary within a TESS sector, a phenomenon that challenges theoretical models. We also find that reliable analysis of these signals with TESS is possible for a moderate fraction of overtone Cepheids. The primary constraints are the limited extent of the data and the relatively poor photometric quality in some Galactic fields. Further careful corrections to the light curves may improve detectability.
Key words: techniques: photometric / stars: oscillations / stars: variables: Cepheids
© The Authors 2025
 Open Access article, published by EDP Sciences, under the terms of the Creative Commons Attribution License (https://creativecommons.org/licenses/by/4.0), which permits unrestricted use, distribution, and reproduction in any medium, provided the original work is properly cited.
This article is published in open access under the Subscribe to Open model. This email address is being protected from spambots. You need JavaScript enabled to view it. to support open access publication.
1. Introduction
Classical Cepheids play an important role in stellar astrophysics. They are primary distance indicators due to their period-luminosity relations and are key components of stellar evolution and pulsation. While most classical Cepheids pulsate in a single radial mode, either the fundamental or the first overtone, multimode pulsations up to the third overtone are not uncommon. Over the past decade, discoveries have revealed the existence of low-amplitude additional periodicities in a significant number of classical Cepheids that cannot be explained by radial pulsation.
The first such signals were reported by Moskalik et al. (2004) in overtone Cepheids of the Large Magellanic Cloud (LMC) observed by the Optical Gravitational Lensing Experiment (OGLE; Udalski et al. 1992). In subsequent years, further discoveries were made, including the detection of additional signals in double-mode Cepheids (Moskalik & Kołaczkowski 2008, 2009). It was soon realized that these additional frequencies form sequences in the Petersen diagram (Petersen 1973) with period ratios (PX/P1O) in the range 0.60–0.65. (Soszyński et al. 2008, 2010). An extensive investigation has revealed another group that has a PX/P1O of ∼1.46 (more often referred to as its reciprocal: a P1O/PX of ∼0.68; Süveges & Anderson 2018). The first member of this group was discovered by Poretti et al. (2014) in data from the CoRoT (Convection, Rotation and planetary Transits) mission (Baglin et al. 2006).
The two groups, designated as the 0.61 and 0.68 groups, were also identified in overtone RR Lyrae (RRc) stars; the 0.61 group stars had similar frequency sequences (see Netzel & Smolec 2019, and references therein). Moreover, the 0.61 signal has been found in an overtone anomalous Cepheid, XZ Cet (Plachy et al. 2021), the only known example of its type so far. In this article we use the notations f0.61 and f0.68, but it should be emphasized that while f0.61 has the higher frequency (shorter period), the frequency of f0.68 is lower (i.e., the period is longer) than that of the first overtone mode.
Since the discovery of these additional periodicities, non-radial pulsation has been suspected to be their origin. Similarly, weak non-radial modes were suggested as the cause of phase curve changes observed in some overtone Cepheids (Klagyivik & Szabados 2009). Detailed theoretical calculations for the 0.61 signals were first provided by Dziembowski (2016). In these non-radial pulsation models, the sequences correspond to the harmonics of the modes with spherical degrees of ℓ = 7, 8, 9 in classical Cepheids and ℓ = 8, 9 in RR Lyrae stars. In RR Lyrae stars, the third sequence consists of combinations of frequencies between these two. The true frequencies in the model are at the 1/2fx subharmonics, which may not appear with detectable amplitudes due to geometric cancelations. In fact, subharmonics are present in only a fraction of stars with 0.61 modes (Smolec & Śniegowska 2016). Theory predicts the ℓ = 10 sequence with a period ratio slightly lower than 0.60. Sequences with this ratio have recently been discovered in RR Lyrae stars by Netzel et al. (2023) and Benkő et al. (2023) using space-based photometry from the K2 (Howell et al. 2014) and Transiting Exoplanet Survey Satellite (TESS; Ricker et al. 2015) missions, respectively. To date, no comprehensive theoretical explanation has been proposed for the 0.68 group. Moreover, the complexity of the issue has increased with the recent discovery that the 0.68 period ratio is also present in fundamental mode RR Lyrae stars (Benkő & Kovács 2023).
In contrast to RR Lyrae stars, where space-based data have been used to search for low-amplitude signals, the majority of Cepheid discoveries have been associated with the OGLE survey. The current number of overtone and double-mode Cepheids with additional frequencies in the Magellanic system is now over two thousand, as recently reported by Smolec et al. (2023). This analysis clearly shows the presence of a third group close to the period of the overtone mode, as originally suggested in the work of Ziółkowska et al. (2020). Explaining these signals is also challenging, as the low-order non-radial modes expected in this region are damped (Mulet-Marquis et al. 2007). Nevertheless, they differ from the periodic modulation peaks detected in some overtone Cepheids.
Our understanding of the occurrence of additional signals in Milky Way Cepheids is more limited. The OGLE mission also provides observations in the Galactic disk and bulge, but much fewer Cepheids with additional signals have been found in these regions (Pietrukowicz et al. 2013; Rathour et al. 2021). The discrepancy is due to a significantly higher detection limit toward the Galactic fields, which in turn is due to the lower sampling rates and shorter baseline of observations. Spectroscopic detection of the 0.61 and 0.68 signals is possible only for bright Galactic Cepheids (Netzel et al. 2024a). The aim of this study is to increase the number of known Galactic Cepheids with additional signals by analyzing the data of the TESS full-frame images (FFIs).
2. Data and method
As demonstrated by previous studies using data from the TESS mission, continuous space photometry is highly effective in detecting low-amplitude features, including additional pulsation modes in RR Lyrae and Cepheid stars (Molnár et al. 2022; Benkő et al. 2023; Plachy et al. 2021). However, an extensive search for additional modes in overtone Cepheids using TESS has not yet been carried out. In this section we describe the characteristics of the TESS data and explain how quality issues can restrict the selection and analysis of targets.
2.1. The properties of TESS data
TESS was designed to collect continuous photometry from almost the entire sky in 27-day sectors. Its field of view spans an area of 24 × 96 degrees and covers the sky in overlapping sectors that rotate around the ecliptic poles. Each sector corresponds to two orbits of the satellite around Earth. This design has several implications for the data. When the spacecraft reaches the perigee, it pauses its observations in order to downlink the accumulated data. This results in a data gap appearing in the middle of the light curves. Scattered light also introduces systematic trends, which are particularly noticeable during certain orbital phases and can vary depending on the specific sector and camera (for a detailed description of this effect, see the TESS Instrument Handbook1).
Although correction methods can significantly reduce the impact of scattered light, the effectiveness can vary depending on the specific characteristics of the target. For high-amplitude pulsators, there is often an average brightness difference between the data from the two orbits. Fortunately, this can be easily corrected by shifting the data. However, if the scattered light was not fully corrected by the photometric pipeline, further detrending is required. Due to the discontinuity, the two orbits of the sectors must be treated separately when detrending. In their study of TESS RRc stars, Benkő et al. (2023) used polynomial fitting via phase dispersion minimization (see also Bódi et al. 2022). Unlike RRc stars, overtone Cepheids can have longer periods (up to 6 days), resulting in a small number of observed pulsation cycles per orbit. Furthermore, additional modes manifest themselves as cycle-to-cycle variations in the light curve. Such variations can be distorted or completely eliminated by a detrending algorithm. Therefore, we decided not to use detrending, but only to correct for the average difference in brightness between the orbits. The measured pulsation amplitudes may also differ between sectors due to changes in position on the detector and the level of contamination. This was also corrected by shifting when data from different sectors were combined.
Even though TESS has a brightness limit of approximately 16 magnitude, the detection of millimagnitude signals becomes uncertain beyond 14–15 mag due to the increased noise level. Consequently, we focused on brighter Cepheids. In recent years, several light curve products and reduction pipelines have become available for processing FFI targets. For this research, we decided to use the light curves from the MIT Quick Look Pipeline (QLP; Huang et al. 2020; Kunimoto et al. 2021, 2022). This processes FFI targets up to magnitude 13.5, and of all the pipelines, this one has processed the most sectors at the time of writing this paper. Light curves are available in the MAST Archive2.
We used photometric QLP data up to Sector 81 (S81). In terms of sampling, this set of data is not uniform. FFIs were taken with a 30-minute cadence in the two years of the Primary Mission (S1–S26), then reduced to 10 minutes in the First Extended Mission (S27–S55) and further reduced to 200 seconds in the Second Extended Mission (from S56). Because a large part of the sky was repeatedly observed in the extended missions, many of the targets were observed at least three times. Several specific regions of the Galactic plane were observed in consecutive sectors. This provides an opportunity to combine successive datasets and improve frequency resolution.
2.2. Target selection and data preparation
We selected the targets for our analysis from the March 2025 version of the Pietrukowicz et al. (2021) catalog3, the most complete and regularly updated list of verified classical Cepheids in the Milky Way, collected from various sky surveys and the literature. The list contains 3644 classical Cepheids, of which 1078 pulsate in the first overtone radial mode. We found QLP data in Sectors 1–81 for 495 stars from the overtone Cepheid group. We used the normalized single aperture flux (SAP_FLUX) data for analysis. Upon inspection of the light curves, it became clear that only a limited sample met our data quality requirements. Noise, trends, contamination, and an insufficient number of observed cycles were the main problems. The latter was due to two factors, either the period of the star was too long or too many poor-quality segments had to be cropped. We found that the spline-detrended data provided by the QLP pipeline (called KSPSAP_FLUX or DET_FLUX in later sectors) do not solve our trend problems. To filter out poor-quality measurements, only the data points with the 0 quality flag were used. Stars with periods longer than 5 days were only examined if data from consecutive sectors could be merged. In data stitching, we used the average value of the peak-to-peak amplitudes as a reference value.
Due to the data quality problems mentioned above, a large fraction of the sample stars were excluded, leaving 301 stars for analysis.
2.3. Analysis
We performed standard Fourier analysis using the open source python code developed by Bódi (2024). To reveal the low-amplitude additional frequencies, we prepared residual spectra by pre-whitening with the main frequency and its harmonics. Our frequency range of interest extends up to the second harmonic. The low-amplitude frequency peaks found in the residual spectra were grouped according to their ratio with the overtone mode. We also searched for combination, harmonic, and subharmonic frequency peaks. We accepted additional frequencies as significant at a signal-to-noise ratio greater than 4.0. The Fourier amplitudes of these peaks, calculated from the relative flux, are usually greater than 0.001, except for the highest-quality light curves where peaks below this limit can be identified. The errors were estimated analytically using the formulae of Breger et al. (1999). We also used the Period04 tool (Lenz & Breger 2005) to verify ambiguous frequency peaks near the significance level.
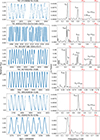 |
Fig. 1. Example TESS QLP light curves and residual spectra for Cepheids with additional signals. Note that the frequency ranges in the right panels are different. Dashed red lines mark the positions of the subtracted frequencies of the first overtone mode (f1O, 2f1O, 3f1O). The low-amplitude peaks identified are labeled. fsh denotes the subharmonic frequency of the f0.61 peak. |
We analyzed the data from each sector individually, as well as the combined data of successive sectors. Due to the large gap between the observations, we did not merge the data from different years together. We also did not merge data from different sectors if there was a significant difference in pulsation amplitudes or data quality.
In Fig. 1 we show example TESS QLP light curves and residual spectra with additional periodicities.
3. Results
In this section we present our results on the different types of low-amplitude periodicities. We present a set of stars in which we have found the second radial overtone (2O). We report new members for the 0.61 and 0.68 groups. We also discuss the additional frequencies found outside the ranges of the above groups, including the possible direct detection of non-radial modes without the harmonic frequency near the 0.61 ratio. Table 1 summarizes our findings. Table 2 includes the full list of stars with additional periodicities. Tables with the pulsation properties can be found in the appendix.
Number of stars found in different groups of additional periodicities.
Name list of stars with additional periodicities (extract).
3.1. Additional radial modes and amplitude modulations
Seventeen stars of our sample show additional variation identified as the second radial mode based on their period ratios and positions on the Petersen diagram (Fig. 2). Their pulsation properties are listed in Table 3. Combination frequencies between 1O and 2O are detected in all cases.
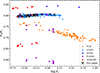 |
Fig. 2. Petersen diagram of radial multimode classical Cepheids in the Milky Way. Colored dots are Cepheids from the Pietrukowicz et al. (2021) catalog or Rathour et al. (2021) candidates. The black crosses show the double mode stars found in this study. |
New 1O2O stars found in the analyzed sample (extract).
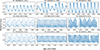 |
Fig. 3. Light curve segments for three 1O2O stars whose amplitude ratios visibly change. The three columns represent the primary and the two extended missions. The sectors from which the data are adopted are indicated in the brackets. |
Most of these stars have been observed in multiple sectors of different years, providing insight into temporal changes in pulsation. Looking at the A2O/A1O amplitude ratios in Table 3, we can see that there are significant differences between sectors for most of them, mainly due to the amplitude variation of the 2O.
There are three stars in the sample where this change is extremely large (Fig. 3). The amplitude ratios in TIC 364898211 (MS Mus) and TIC 438112973 (GM Ori) change by a factor of more than 10. The existence of the 2O overtone has been reported for both stars (see Khruslov 2013 and Rathour et al. 2021), but was later not detected in the Gaia Data Release 3 (DR3) data (Ripepi et al. 2023). The third star in Fig. 3, TIC 455190351 (OGLE GD-CEP-1869), shows the largest amplitude variation (A2O/A1O changes by a factor of ∼30). We reanalyzed the OGLE I-band photometry for this star and found that it was not possible to recover the 2O due to the daily aliases.
The three stars presented above are likely members of the 1O2O group exhibiting high-amplitude periodic modulation. This phenomenon was reported by Moskalik et al. (2004) and Moskalik & Kołaczkowski (2009) and more recently by Smolec et al. (2023) in Cepheids of the Magellanic Clouds. The group is characterized by anticorrelated amplitude and phase modulations with periods over 700 days. The variations detected in these stars are similar to the mysterious phenomenon commonly seen in RR Lyrae stars called the Blazhko effect (Blažko 1907). With data from the future TESS cycles, we hope to learn more about these stars and perhaps even determine the modulation periods.
Another important question besides modulation is whether double radial mode Cepheids can exhibit similar additional periodicities to their 1O counterparts. Such stars have already been discovered in the Magellanic System (Smolec et al. 2023): nineteen F1O stars with the f0.61 frequency and four with f0.68, of which one shows both types of additional variability. One example of a 1O2O and another of a 1O3O Cepheid with additional f0.61 frequency are also known. We were unable to find any signals in our double-mode stars that could be attributed to f0.61 or f0.68. The majority of the low-amplitude frequency peaks can be explained by a linear combination of the two radial modes. We found other weak signals appearing at seemingly random frequencies in roughly half of the sample. We suspect that these are due to contamination. We also detected residual power around the radial modes after pre-whitening, which is likely due to the amplitude variations in the stars discussed above.
3.2. The 0.68 group
We found 15 stars where a clear additional signal at P1O/PX ∼ 0.68 is visible (see Table 4). Of these, 14 are new discoveries. The f0.68 signal was detected in TIC 197776441 (V0411 Lac) by Netzel et al. (2024a) in spectroscopic time series. Our analysis confirms the visibility of this periodicity in the photometric data of the star.
Stars with additional frequencies near the P1O/P0.68 ∼ 0.68 ratio (extract).
Six stars from the 0.68 group are also members of the 0.61 group. We did not find the combination frequency of these two types of signals in either case. The combination frequency with the first overtone mode (f1O + f0.68) appears in only two stars, in TIC 307298395 and TIC 239378995. This latter star shows other additional periodicities too (see Sect. 3.5). The remaining seven stars of the sample show no additional periodicities apart from f0.68.
We calculated the period ratio for the 15 stars in different sectors and plot the results in Fig. 4, along with the period ratios found in the 0.67–0.70 range for stars in the Magellanic Clouds, determined by Smolec et al. (2023), for comparison. The two sets of stars show a similar scatter in the P1O/P0.68 values, but for the stars in the TESS sample, the period ratios derived from the different sectors differ significantly for some stars. The connected symbols refer to the same star in Fig. 4. It is not clear whether this is an intrinsic effect or due to the possible underestimation of the errors. However, if the f0.68 frequency varies over time, this is inconsistent with the findings of Smolec et al. (2023), who reported f0.68 to be coherent. The difference in metallicity between the Cepheids of the Magellanic System and the Milky Way may be a contributing factor.
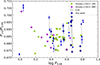 |
Fig. 4. Petersen diagram of the 0.68 stars found in this work (blue squares) and by Smolec et al. (2023) in the same range of period ratios (green diamonds for the LMC and purple dots for the SMC). The values derived for the same stars, but from different sectors, are connected with black lines. |
3.3. The 0.61 group
The search for additional frequencies at PX/P1O ∼ 0.6 − 0.65 resulted in 83 stars. It is quite common that these form a combination frequency with the overtone mode, the presence of which confirms the detection (marked with a “c” in Table 5). Among the combinations, f1O + f0.61 is always present, with 2f1O + f0.61 and f0.61 − f1O being occasionally visible (mostly a function of data quality, not specifically marked in Table 5). The subharmonic frequency (fsh ∼ 0.5f0.61) appears in almost all stars in at least one sector. We found only five stars where a significant peak could not be identified in the subharmonic region, in any sector. In certain instances, only power excess is apparent, rather than a subharmonic peak (this is marked with “p”).
Stars with additional frequencies near the P0.61/P1O ∼ 0.60 − 0.65 ratio (extract).
The 0.61 group is displayed on the Petersen diagram in Fig. 5. These are plotted together with the previously identified Galactic 0.61 stars. The values corresponding to the same stars are connected, and those that have the f0.61 in addition are marked with a circle. The figure does not clearly show the three sequences, which are well defined in the Small Magellanic Cloud (SMC) and less pronounced in the LMC (see Fig. 5 in Smolec et al. 2023). However, Rathour et al. (2021) have already shown some indications of a sequenced structure in the Galactic 0.61 group in the bottom panels of Fig. 6 in their paper. To check whether the sequences exist in the sample, we calculated projected distributions and displayed them in Fig. 6. First we used the slope that was determined for the middle sequence of the LMC stars (P0.61/P1O = a log P1O + b, where a = −0.0319, and b = 0.6332 from Smolec et al. 2023). This is marked with pink. The histogram shows that there is an indication of middle and bottom sequences, but existence of the upper sequence is ambiguous. We also fitted the slope to the data, by optimizing the distribution to show more distinct groups. That resulted in the steeper slope (a = −0.0532, and b = 0.6420) shown in cyan. While the boundaries are slightly better visible, the upper sequence remains poorly defined.
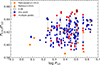 |
Fig. 5. Petersen diagram of the 0.61 group. The previously discovered Galactic members of the group (Pietrukowicz et al. 2013; Rathour et al. 2021) are marked with orange asterisk and triangles. Black lines connect the values for the same star. Red symbols denote stars for which we found multiple peaks for the 0.61 frequency group in the same light curve. The stars that are also members of the 0.68 group are marked with circles. |
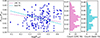 |
Fig. 6. Distributions of the projected period ratios perpendicular to the reference lines calculated for the middle sequence for the LMC (pink) and perpendicular to the best fit to the dots (cyan). |
In twelve stars, we were able to detect multiple f0.61 peaks (indicated in red in Fig. 5). Six of these stars also exhibit multiple fsh peaks, which were detected in either the same or in different sectors. A further fifteen stars only show multiplets at fsh. The vast majority of close frequencies satisfy the traditional Rayleigh criterion for frequency resolution (Δf = 1/T, where T is the length of the data). However, we identified frequency pairs closer than the Rayleigh frequency in thirteen stars of the 0.61 group. In five cases, these frequencies are clearly resolved in other sectors, suggesting that we can go slightly beyond 1/T. Kallinger & Weiss (2017) have demonstrated on simulated data that peaks as close as ∼0.5/T can still be reliably distinguished. The closest frequencies in our sample are separated by 0.67/T (TIC 4712990), satisfying this criterion.
The multiple f0.61 peaks in Fig. 5 appear to belong to different sequences for some stars, while for others these peaks are too close to be identified as separate sequences. Additionally, the correspondence between the fsh and the f0.61 peaks remains ambiguous. We made an attempt to pair them as closely as possible to the 0.5 ratio. A more in-depth examination of the subharmonics reveals that the ratio can vary significantly, ranging from 0.44 to 0.56. As Fig. 7 illustrates, the distribution of these ratios is characterized by an observed asymmetry, which indicates that the fsh/f0.61 > 0.5 ratio is more prevalent (58 percent). Similar histograms were also produced for the Magellanic Clouds (see Fig. 7 in Smolec et al. 2023), also finding the ratios above 0.5 to be slightly more frequent.
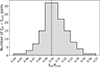 |
Fig. 7. Distribution of the fsh/f0.61 frequency ratios. A slight overabundance is visible on the right side. |
The amplitudes of both f0.61 and fsh vary significantly over time. Which of the two frequencies is the dominant in the residual spectra often varies. This variation is even present between successive sectors, as demonstrated in Fig. 8. It is not clear whether this is caused by a real amplitude change or by the temporal appearance of nearby frequencies that are unresolved. The frequency values also often change between the different sectors, similar to what we saw at f0.68. For 21 stars, we found that f0.61 disappears in one or even several sectors, and only fsh is detectable. We also found multiple subharmonics in some of the stars, some of which had no matching signal in the 0.6–0.65 period ratio (see Sect. 3.5). We note here that the considerable number of stars with noncoherent f0.61 and fsh frequencies in the OGLE measurements reported by Smolec et al. (2023) suggests that temporal variations among these signals are prevalent. Temporal variability of the 0.61 signal was also observed in RR Lyrae stars (Szabó et al. 2014; Moskalik et al. 2015; Benkő et al. 2023; Netzel et al. 2023).
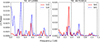 |
Fig. 8. Residual spectra for TIC 4712990 and TIC 44753014 after pre-whitening with the main pulsational frequency and its harmonics (f1O, 2f1O, and 3f1O marked with dotted black lines) computed from data of consecutive sectors (solid red and dashed blue lines). The figures demonstrate amplitude variations in the fsh and f0.61 detected on a short timescale. |
We examined the amplitude ratios of the f0.61 and fsh peaks in more detail. In the upper panels of Fig. 9, the amplitude ratios of the 0.61 frequency with respect to the overtone mode are displayed. The values range from 0.005 to 0.07, with higher occurrences toward lower A0.61/A1O ratios. However, in the upper right panel, it is apparent that the higher amplitude ratio toward the central frequency ratios (i.e., the potential mid-sequence) is more frequent. If this is a real effect, then the limit of detectability is more likely to be reached in the middle sequence, which may result in a more populated appearance. The lower panels show the amplitude ratio of the subharmonics to the 0.61 peaks. Here, we find that the Ash is more often greater than A0.61 (in 58 percent of cases). With this feature, they resemble the LMC Cepheids, while in the SMC we observe the opposite. The presence of f0.68 does not appear to have any effect on the amplitude ratios.
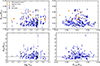 |
Fig. 9. Amplitude ratios of the 0.61 peaks relative to the first overtone mode, and the subharmonic peak. Values are given as a function of the main pulsation period (left) and the P0.61/P1O period ratio (right). Symbols are the same as in Fig. 5. |
The frequency 1.5f0.61 is commonly seen in RR Lyrae stars, but we find it in only nine of our stars. These are labeled “hif” (half-integer frequencies) in the Table 5. Interestingly, two of these stars, TIC 123734693 and TIC 234943347, also have the combination f1O + 1.5f0.61. In the former star, 1.5f0.61 is much stronger than f0.61. We also searched for the combination of the subharmonic and the first overtone. In two stars, we found a signal that could match the combination of f1O + fsh (TIC 126545806 and TIC 272999674). This combination is also observed in stars that are considered to be members of the 0.61 group, where only the subharmonic is detected (see Sect. 3.5).
We identified the presence of quasi-symmetrically located peaks on either side of the overtone frequency in three stars. These could be signs of weak amplitude modulation; therefore, we mark these stars as “mod?” in the Table 5. Further observations of these candidate modulated stars are necessary to confirm this suspicion.
Of the stars in our 0.61 group, four were also studied in Rathour et al. (2021): TIC 113843324, TIC 126545806, TIC 147184001, and TIC 317210786. A direct comparison of the P0.61/P1O ratios derived from TESS and OGLE data reveals discrepancies. However, this is to be expected from noncoherent signals investigated on very different timescales. Nevertheless, the fact that the 0.61 signal of these four stars has been detected by multiple surveys provides robust confirmation of their membership of the group. Moreover, the present analysis confirms the spectroscopic detection of the 0.61 signal in V0391 Nor (TIC 283374564) reported by Netzel et al. (2024a). Unfortunately, for the other stars in that study, BG Cru and QZ Nor, the 0.61 signal could not be detected unambiguously.
For a significant proportion of the stars examined, we found that the signal was likely to be present, albeit not reaching a level of statistical significance or the residual spectrum was too blurred due to instrumental problems. These stars with uncertain detections are not listed here, but will be the subject of further future investigations, with the aim of solving the detrending problems mentioned in Sect. 2.1.
3.4. Metallicity dependence of the 0.61 signal
Metallicity may play an important role in the appearance of non-radial modes. Rathour et al. (2021) identified a systematic shift toward longer periods with increasing metallicity when comparing the 0.61 sequences in the SMC, LMC, and the Milky Way. These sequences are illustrated in Fig. 10, where we also include our results. The position of the Galactic sample in the Petersen diagram further supports the theory that the metallicity-related trend could be genuine. We calculated the mean periods to be 1.826, 2.375 and 2.685 days for the SMC, LMC, and Galactic 0.61 stars, respectively. These values also indicate the trend, even though the longest-period stars could not be investigated with TESS.
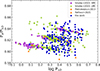 |
Fig. 10. Petersen diagram of 0.61 groups in the SMC (purple dots), LMC (green diamonds), and the Milky Way (orange and blue symbols), revealing a noticeable shift toward longer periods in the more metal-rich environments. |
Theoretical calculations suggest that the incidence rate of non-radial modes decreases with decreasing metallicity for RR Lyrae models (Netzel et al. 2024b). The distribution of photometric metallicity for TESS RRc stars with 0.61 signals, analyzed by Benkő et al. (2023), also supports this prediction. With our newly discovered sample of 0.61 stars, we can investigate whether a similar connection exists in Cepheids. In this analysis, we used the recent collection of literature spectroscopic metallicities of Galactic Cepheids by Trentin et al. (2023). [Fe/H] indices are available for 282 first-overtone stars in that catalog, of which 51 stars match with our stars in the 0.61 group. We could include one additional star from the “Group1” by Rathour et al. (2021), OGLE-GD-CEP-0041. The values are displayed as a function of the pulsation period in Fig. 11. The distribution was calculated for the period range in which the 0.61 stars were identified (indicated by the vertical dashed line). The histograms on the right side of the figure present the counts and percentages of the 0.61 stars in each bin. This latter indicates that the distribution is relatively uniform, with no large variation observed against metallicity. Nevertheless, the result must be treated with caution for two reasons. Firstly, the sample is small and it is possible that new discoveries will significantly change the picture. Secondly, the uncertainties of [Fe/H] indices are large, spanning up to a significant fraction of the parameter range.
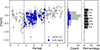 |
Fig. 11. Metallicity-period diagram of the 0.61 stars, based on data collected by Trentin et al. (2023). The metallicity distribution is calculated for the period range within the dashed lines. No clear connection is visible between [Fe/H] and occurrence rates. |
3.5. Other periodicities
We found several stars with low-amplitude periodicities that fall outside of the 0.68 and 0.61 periodicity ranges. These are listed in Table 6. The vast majority of these periodicities have periods longer than the overtone mode. We found signals with shorter periodicities only in three stars. Of these, we observe the combination peak with the overtone in one case (TIC 281312636). Signals that have a period longer than the overtone are shown in Fig. 12.
Stars with other additional frequencies (extract).
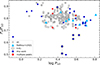 |
Fig. 12. Petersen diagram for the other additional modes. Stars from “Group 2” in Rathour et al. (2021) are marked with light blue triangles. Gray dots indicate the positions of the subharmonics of the 0.61 group presented in Sect. 3.3. The crosses denote those subharmonics for which a matching f0.61 peak was identified. |
Some of these additional signals fall within the range in which we would expect to find the period ratios of subharmonic frequencies to the first overtone mode. So, it can be hypothesized that these are members of the 0.61 group, wherein solely the subharmonic, i.e., the theoretical non-radial mode frequencies are observed. In Fig. 12, the period ratios between the subharmonics and the first overtone mode from the 0.61 group are shown with gray symbols. The periodicities identified in this range by Rathour et al. (2021) and designated as “Group 2” are indicated by light blue triangles. They also speculated that these could be direct detections of non-radial modes. The same hypothesis was also mentioned in the study of the Magellanic Clouds for signals in the same range by Smolec et al. (2023). In a subset of these cases, the f1O + fx combination frequency also appears. The combination frequencies of the subharmonic with the first overtone mode have previously been simulated for RRc stars (Netzel & Kolenberg 2021) and have been found in observations (Benkő et al. 2023).
In Fig. 12, the presence of a matching f0.61 peak for the subharmonics is indicated by crosses. There are many subharmonics that have no matching f0.61 peak, as shown by the gray dots without crosses found at both the lower and higher edges of the subharmonic range.
Signals also appear far from the subharmonic cluster, even at a period ratio of ∼0.5. For example in TIC 39141607, of which this strange periodicity can also be seen in the photometric data collected by the All Sky Automated Survey for SuperNovae4 (ASAS-SN; Kochanek et al. 2017). Additional frequency peaks found at a period ratio higher than 0.95 with the main pulsation mode were not included here, as we cannot distinguish them from instrumental signals (e.g., peaks due to amplitude differences between orbits and sectors). For the same reasons we ignored the very low-frequency signals as well. Moreover, TESS measurements have a relatively poor spatial resolution, and there is a high chance of contamination. So, we are unsure of the origin of additional low-amplitude signals outside the known groups, especially if they have no combination frequency with the overtone mode.
3.6. Comments on temporal variation and stars with no additional frequencies
As demonstrated in Fig. 8, temporal variation of the additional signals can occur on a timescale as short as one month. To conduct a more detailed investigation, we used time-dependent analysis with a 30-day sliding window with 3-day step size for stars observed over three consecutive sectors. The amplitude variations of additional frequencies in three star are presented in Fig. 13. Despite the limited time span, which prevents the observation of cyclic variations, it is possible to see that the change in the amplitude of the 0.61 signal and its subharmonic is different, and sometimes they appear to be anticorrelated. The amplitude variation of f0.68 in the third star also does not follow any of the other two signals. In the case of other stars within the 0.61 group, it is seen that an increase in the amplitude of fsh is accompanied by the vanishing of f0.61, and the combination of f1O + fsh becomes visible. We found no examples in which the 0.61 signal and subharmonic both completely disappear at the same time.
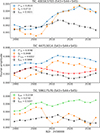 |
Fig. 13. Amplitude evolution of the low-amplitude signals of TIC 400163703, TIC 44753014, and TIC 59617576 observed in three consecutive sectors. The asterisk indicates the higher amplitude peak of the subharmonics and the associated 0.61 frequency where it is present. |
The underlying physics of the temporal variation of these signals is an open question and would require detailed modeling to understand. In Dziembowski’s model of a slowly rotating and oscillating star, geometric cancellation plays a crucial role in the appearance of f0.61 and fsh. It has been shown that a much simpler frequency spectrum and less variability are expected near f0.61 than at fsh (see Sect. 3 in Dziembowski 2016). This is consistent with what we observe in Fig. 13. We speculate that an oblique pulsation axis could also be behind this variability, in which case a cyclic variation with the rotation period would be expected. The estimated rotation periods for Classical Cepheids are consistent with this hypothesis (see Anderson et al. 2016). On the other hand, if the visibility of the pulsation geometry is unchanged, we could observe the beating of a rotational multiplet (e.g., m = −1, 0, +1), which might appear as a complex, quasi-periodic change. The 0.61 signal and subharmonics have also been found to be highly variable in RRc stars in the data of various space observations (Szabó et al. 2014; Moskalik et al. 2015; Netzel et al. 2023; Benkő et al. 2023). However, the variability occurs on a timescale ranging from 10 to 200 days and is characterized by its irregular nature. It is therefore evident that rotation cannot play a role in this variability, since RR Lyrae stars are much slower rotators (Peterson et al. 1996).
It is important to note that the analysis presented is very sensitive to the quality of the data. We tried to use as many TESS sectors as possible for each star, but not all of them were suitable for unambiguous analysis. These sectors are not included in the tables of the appendix. On the other hand, we have found several stars with high quality data in which no additional signal can be found. We illustrate this in Fig. 14, where we plot the residual spectra and the phase-folded light curves in three stars that clearly show the absence of additional signals.
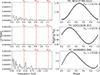 |
Fig. 14. Residual spectra and phase-folded light curves of example first-overtone Cepheids with no additional signals. |
4. Summary
The majority of known Galactic classical Cepheids have been observed by TESS. However, due to the mission’s design and quality issues, we could only conduct a search for low-amplitude periodicities in a limited sample size. A brief summary of our results is presented below.
-
We identified a total of 17 radial double mode (1O2O) stars, including two that had previously been suspected of belonging to the class. Furthermore, we observed large changes in mode amplitudes between the sectors from different years, which may be an indication of a periodic amplitude modulation phenomenon.
-
We discovered 79 new members of the 0.61 group (and confirmed 4 others) and 14 new members of the 0.68 group (and confirmed 1 other) of overtone Cepheid stars. Six show both signals. The sequences in the Petersen diagram of the 0.61 signals are significantly less clear than those observed for the SMC or LMC. Of the three sequences, only two are discernible.
-
We observed temporal variations in frequencies and amplitudes in both the 0.61 and 0.68 signals. The timescale appears to be on the order of months for some stars. The origin of the variation remains unclear; in several cases, amplitude modulation of the radial mode is suspected. Longer, uninterrupted high-cadence space observations may be required for a more detailed study of temporal changes.
-
We found additional low-amplitude frequencies outside the period ranges of the second overtone mode and the 0.68 and 0.61 signals. In 11 stars, these frequencies are close to the range in which subharmonic frequencies, i.e., the signal of the non-radial mode, are expected. We suggest that these stars are candidate 0.61 stars.
These newly discovered 0.61 stars, added to the previous discoveries of Rathour et al. (2021) and Netzel et al. (2024a), give us an incidence rate lower limit of ∼8.7 percent of all overtone Cepheids in the Milky Way. Taking into account the 13.5 Tmag brightness limit we applied, this rises to around 18 percent. For comparison, the incidence rate was found to be 12.6 and 16.5 percent in the SMC and LMC, respectively (see Smolec et al. 2023). We suspect that there are many more stars with low-amplitude periodicities that we were unable to detect due to instrumental trends. It is challenging to distinguish between intrinsic and instrumental additional variability in data with a low number of cycles. Developing a detrending algorithm to resolve this problem could significantly improve detection rates. Additionally, future TESS observations of regions in the Galactic plane will likely yield further insights into the pulsation nature of classical Cepheids.
Data availability
The full versions of Tables 2–6 are available at the CDS via anonymous ftp to https://cdsarc.cds.unistra.fr/viz-bin/cat/J/A+A/703/A155
Acknowledgments
This paper includes data collected by the and TESS mission. Funding for the missions are provided by the NASA Science Mission Directorate. The research was partially supported by the ‘SeismoLab’ KKP-137523 Élvonal grant of the Hungarian Research, Development and Innovation Office (NKFIH). Some python codes were developed with the help of ChatGPT 4.0. The authors would also like to gratefully thank József Benkő for the fruitful discussions on this topic. HN acknowledges support from the European Research Council (ERC) under the European Union’s Horizon 2020 research and innovation program (grant agreement No. 951549 – UniverScale). We thank the referee for their comments that helped to improve the paper.
References
- Anderson, R. I., Saio, H., Ekström, S., Georgy, C., & Meynet, G. 2016, A&A, 591, A8 [NASA ADS] [CrossRef] [EDP Sciences] [Google Scholar]
- Baglin, A., Auvergne, M., Boisnard, L., et al. 2006, in 36th COSPAR Scientific Assembly, 36, 3749 [Google Scholar]
- Benkő, J. M., & Kovács, G. B. 2023, A&A, 680, L6 [NASA ADS] [CrossRef] [EDP Sciences] [Google Scholar]
- Benkő, J. M., Plachy, E., Netzel, H., et al. 2023, MNRAS, 521, 443 [Google Scholar]
- Blažko, S. 1907, Astron. Nachr., 175, 325 [Google Scholar]
- Bódi, A. 2024, J. Open Source Softw., 9, 7118 [Google Scholar]
- Bódi, A., Szabó, P., Plachy, E., Molnár, L., & Szabó, R. 2022, PASP, 134, 014503 [CrossRef] [Google Scholar]
- Breger, M., Handler, G., Garrido, R., et al. 1999, A&A, 349, 225 [NASA ADS] [Google Scholar]
- Dziembowski, W. A. 2016, Commun. Konkoly Obs. Hung., 105, 23 [Google Scholar]
- Howell, S. B., Sobeck, C., Haas, M., et al. 2014, PASP, 126, 398 [Google Scholar]
- Huang, C. X., Vanderburg, A., Pál, A., et al. 2020, Res. Notes Am. Astron. Soc., 4, 204 [Google Scholar]
- Kallinger, T., & Weiss, W. W. 2017, in Second BRITE-Constellation Science Conference: Small Satellites – Big Science, eds. K. Zwintz, & E. Poretti, 5, 113 [Google Scholar]
- Khruslov, A. V. 2013, Astron. Nachr., 334, 866 [Google Scholar]
- Klagyivik, P., & Szabados, L. 2009, A&A, 504, 959 [NASA ADS] [CrossRef] [EDP Sciences] [Google Scholar]
- Kochanek, C. S., Shappee, B. J., Stanek, K. Z., et al. 2017, PASP, 129, 104502 [Google Scholar]
- Kunimoto, M., Huang, C., Tey, E., et al. 2021, Res. Notes Am. Astron. Soc., 5, 234 [Google Scholar]
- Kunimoto, M., Tey, E., Fong, W., et al. 2022, Res. Notes Am. Astron. Soc., 6, 236 [Google Scholar]
- Lenz, P., & Breger, M. 2005, CoAst, 146, 53 [NASA ADS] [Google Scholar]
- Molnár, L., Bódi, A., Pál, A., et al. 2022, ApJS, 258, 8 [CrossRef] [Google Scholar]
- Moskalik, P., & Kołaczkowski, Z. 2008, CoAst, 157, 343 [Google Scholar]
- Moskalik, P., & Kołaczkowski, Z. 2009, MNRAS, 394, 1649 [Google Scholar]
- Moskalik, P., Kołaczkowski, Z., & Mizerski, T. 2004, ASP Conf. Ser., 310, 498 [Google Scholar]
- Moskalik, P., Smolec, R., Kolenberg, K., et al. 2015, MNRAS, 447, 2348 [NASA ADS] [CrossRef] [Google Scholar]
- Mulet-Marquis, C., Glatzel, W., Baraffe, I., & Winisdoerffer, C. 2007, A&A, 465, 937 [NASA ADS] [CrossRef] [EDP Sciences] [Google Scholar]
- Netzel, H., & Kolenberg, K. 2021, MNRAS, 508, 3508 [CrossRef] [Google Scholar]
- Netzel, H., & Smolec, R. 2019, MNRAS, 487, 5584 [NASA ADS] [CrossRef] [Google Scholar]
- Netzel, H., Molnár, L., Plachy, E., & Benkő, J. M. 2023, A&A, 677, A177 [NASA ADS] [CrossRef] [EDP Sciences] [Google Scholar]
- Netzel, H., Anderson, R. I., & Viviani, G. 2024a, A&A, 687, A118 [NASA ADS] [CrossRef] [EDP Sciences] [Google Scholar]
- Netzel, H., Varga, V., Szabó, R., Smolec, R., & Plachy, E. 2024b, A&A, 692, A133 [NASA ADS] [CrossRef] [EDP Sciences] [Google Scholar]
- Petersen, J. O. 1973, A&A, 27, 89 [NASA ADS] [Google Scholar]
- Peterson, R. C., Carney, B. W., & Latham, D. W. 1996, ApJ, 465, L47 [Google Scholar]
- Pietrukowicz, P., Dziembowski, W. A., Mróz, P., et al. 2013, Acta Astron., 63, 379 [Google Scholar]
- Pietrukowicz, P., Soszyński, I., & Udalski, A. 2021, Acta Astron., 71, 205 [NASA ADS] [Google Scholar]
- Plachy, E., Pál, A., Bódi, A., et al. 2021, ApJS, 253, 11 [NASA ADS] [CrossRef] [Google Scholar]
- Poretti, E., Baglin, A., & Weiss, W. W. 2014, ApJ, 795, L36 [Google Scholar]
- Rathour, R. S., Smolec, R., & Netzel, H. 2021, MNRAS, 505, 5412 [NASA ADS] [CrossRef] [Google Scholar]
- Ricker, G. R., Winn, J. N., Vanderspek, R., et al. 2015, J. Astron. Telesc. Instrum. Syst., 1, 014003 [Google Scholar]
- Ripepi, V., Clementini, G., Molinaro, R., et al. 2023, A&A, 674, A17 [NASA ADS] [CrossRef] [EDP Sciences] [Google Scholar]
- Smolec, R., & Śniegowska, M. 2016, MNRAS, 458, 3561 [NASA ADS] [CrossRef] [Google Scholar]
- Smolec, R., Ziółkowska, O., Ochalik, M., & Śniegowska, M. 2023, MNRAS, 519, 4010 [NASA ADS] [CrossRef] [Google Scholar]
- Soszyński, I., Poleski, R., Udalski, A., et al. 2008, Acta Astron., 58, 163 [NASA ADS] [Google Scholar]
- Soszyński, I., Poleski, R., Udalski, A., et al. 2010, Acta Astron., 60, 17 [NASA ADS] [Google Scholar]
- Süveges, M., & Anderson, R. I. 2018, MNRAS, 478, 1425 [CrossRef] [Google Scholar]
- Szabó, R., Benkő, J. M., Paparó, M., et al. 2014, A&A, 570, A100 [NASA ADS] [CrossRef] [EDP Sciences] [Google Scholar]
- Trentin, E., Ripepi, V., Catanzaro, G., et al. 2023, MNRAS, 519, 2331 [Google Scholar]
- Udalski, A., Szymanski, M., Kaluzny, J., Kubiak, M., & Mateo, M. 1992, Acta Astron., 42, 253 [NASA ADS] [Google Scholar]
- Ziółkowska, O., Styczeń, M., & Smolec, R. 2020, in XXXIX Polish Astronomical Society Meeting, eds. K. Małek, M. Polińska, A. Majczyna, et al., 10, 75 [Google Scholar]
All Tables
Stars with additional frequencies near the P0.61/P1O ∼ 0.60 − 0.65 ratio (extract).
All Figures
|
Fig. 1. Example TESS QLP light curves and residual spectra for Cepheids with additional signals. Note that the frequency ranges in the right panels are different. Dashed red lines mark the positions of the subtracted frequencies of the first overtone mode (f1O, 2f1O, 3f1O). The low-amplitude peaks identified are labeled. fsh denotes the subharmonic frequency of the f0.61 peak. |
| In the text | |
|
Fig. 2. Petersen diagram of radial multimode classical Cepheids in the Milky Way. Colored dots are Cepheids from the Pietrukowicz et al. (2021) catalog or Rathour et al. (2021) candidates. The black crosses show the double mode stars found in this study. |
| In the text | |
|
Fig. 3. Light curve segments for three 1O2O stars whose amplitude ratios visibly change. The three columns represent the primary and the two extended missions. The sectors from which the data are adopted are indicated in the brackets. |
| In the text | |
|
Fig. 4. Petersen diagram of the 0.68 stars found in this work (blue squares) and by Smolec et al. (2023) in the same range of period ratios (green diamonds for the LMC and purple dots for the SMC). The values derived for the same stars, but from different sectors, are connected with black lines. |
| In the text | |
|
Fig. 5. Petersen diagram of the 0.61 group. The previously discovered Galactic members of the group (Pietrukowicz et al. 2013; Rathour et al. 2021) are marked with orange asterisk and triangles. Black lines connect the values for the same star. Red symbols denote stars for which we found multiple peaks for the 0.61 frequency group in the same light curve. The stars that are also members of the 0.68 group are marked with circles. |
| In the text | |
|
Fig. 6. Distributions of the projected period ratios perpendicular to the reference lines calculated for the middle sequence for the LMC (pink) and perpendicular to the best fit to the dots (cyan). |
| In the text | |
|
Fig. 7. Distribution of the fsh/f0.61 frequency ratios. A slight overabundance is visible on the right side. |
| In the text | |
|
Fig. 8. Residual spectra for TIC 4712990 and TIC 44753014 after pre-whitening with the main pulsational frequency and its harmonics (f1O, 2f1O, and 3f1O marked with dotted black lines) computed from data of consecutive sectors (solid red and dashed blue lines). The figures demonstrate amplitude variations in the fsh and f0.61 detected on a short timescale. |
| In the text | |
|
Fig. 9. Amplitude ratios of the 0.61 peaks relative to the first overtone mode, and the subharmonic peak. Values are given as a function of the main pulsation period (left) and the P0.61/P1O period ratio (right). Symbols are the same as in Fig. 5. |
| In the text | |
|
Fig. 10. Petersen diagram of 0.61 groups in the SMC (purple dots), LMC (green diamonds), and the Milky Way (orange and blue symbols), revealing a noticeable shift toward longer periods in the more metal-rich environments. |
| In the text | |
|
Fig. 11. Metallicity-period diagram of the 0.61 stars, based on data collected by Trentin et al. (2023). The metallicity distribution is calculated for the period range within the dashed lines. No clear connection is visible between [Fe/H] and occurrence rates. |
| In the text | |
|
Fig. 12. Petersen diagram for the other additional modes. Stars from “Group 2” in Rathour et al. (2021) are marked with light blue triangles. Gray dots indicate the positions of the subharmonics of the 0.61 group presented in Sect. 3.3. The crosses denote those subharmonics for which a matching f0.61 peak was identified. |
| In the text | |
|
Fig. 13. Amplitude evolution of the low-amplitude signals of TIC 400163703, TIC 44753014, and TIC 59617576 observed in three consecutive sectors. The asterisk indicates the higher amplitude peak of the subharmonics and the associated 0.61 frequency where it is present. |
| In the text | |
|
Fig. 14. Residual spectra and phase-folded light curves of example first-overtone Cepheids with no additional signals. |
| In the text | |
Current usage metrics show cumulative count of Article Views (full-text article views including HTML views, PDF and ePub downloads, according to the available data) and Abstracts Views on Vision4Press platform.
Data correspond to usage on the plateform after 2015. The current usage metrics is available 48-96 hours after online publication and is updated daily on week days.
Initial download of the metrics may take a while.