Open Access
Fig. 12.
Download original image
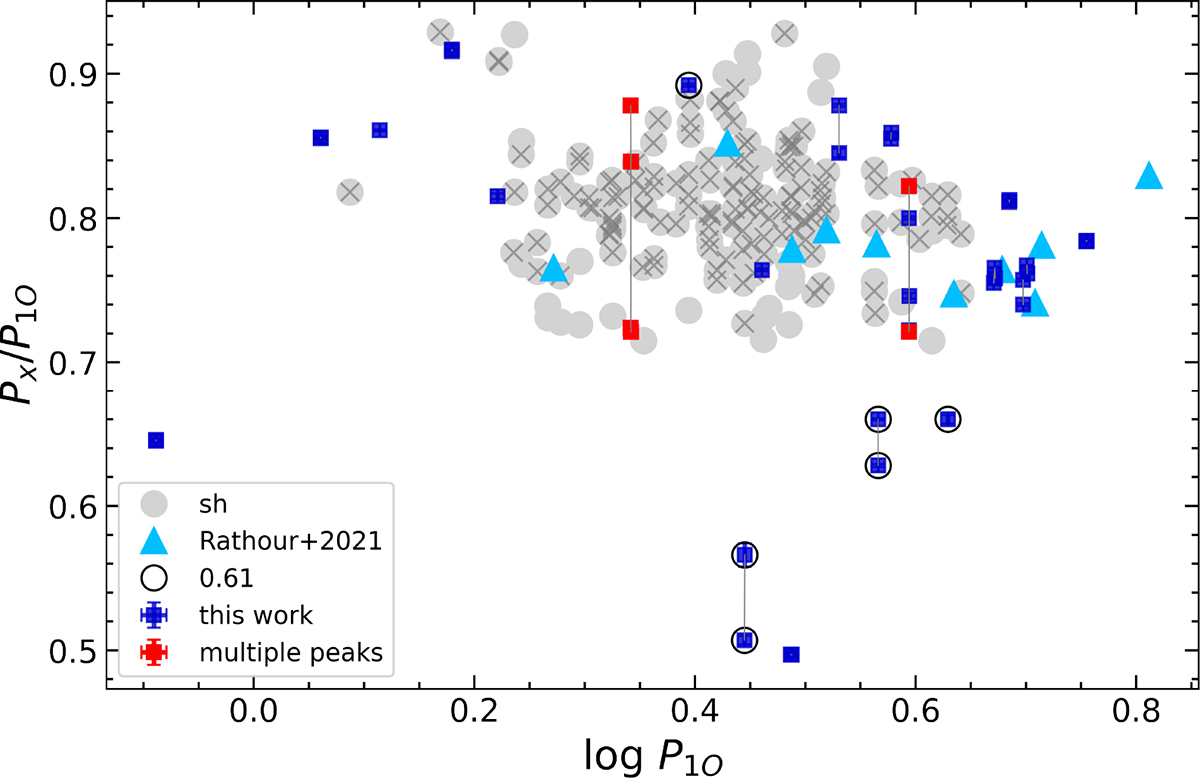
Petersen diagram for the other additional modes. Stars from “Group 2” in Rathour et al. (2021) are marked with light blue triangles. Gray dots indicate the positions of the subharmonics of the 0.61 group presented in Sect. 3.3. The crosses denote those subharmonics for which a matching f0.61 peak was identified.
Current usage metrics show cumulative count of Article Views (full-text article views including HTML views, PDF and ePub downloads, according to the available data) and Abstracts Views on Vision4Press platform.
Data correspond to usage on the plateform after 2015. The current usage metrics is available 48-96 hours after online publication and is updated daily on week days.
Initial download of the metrics may take a while.