Open Access
Fig. 4.
Download original image
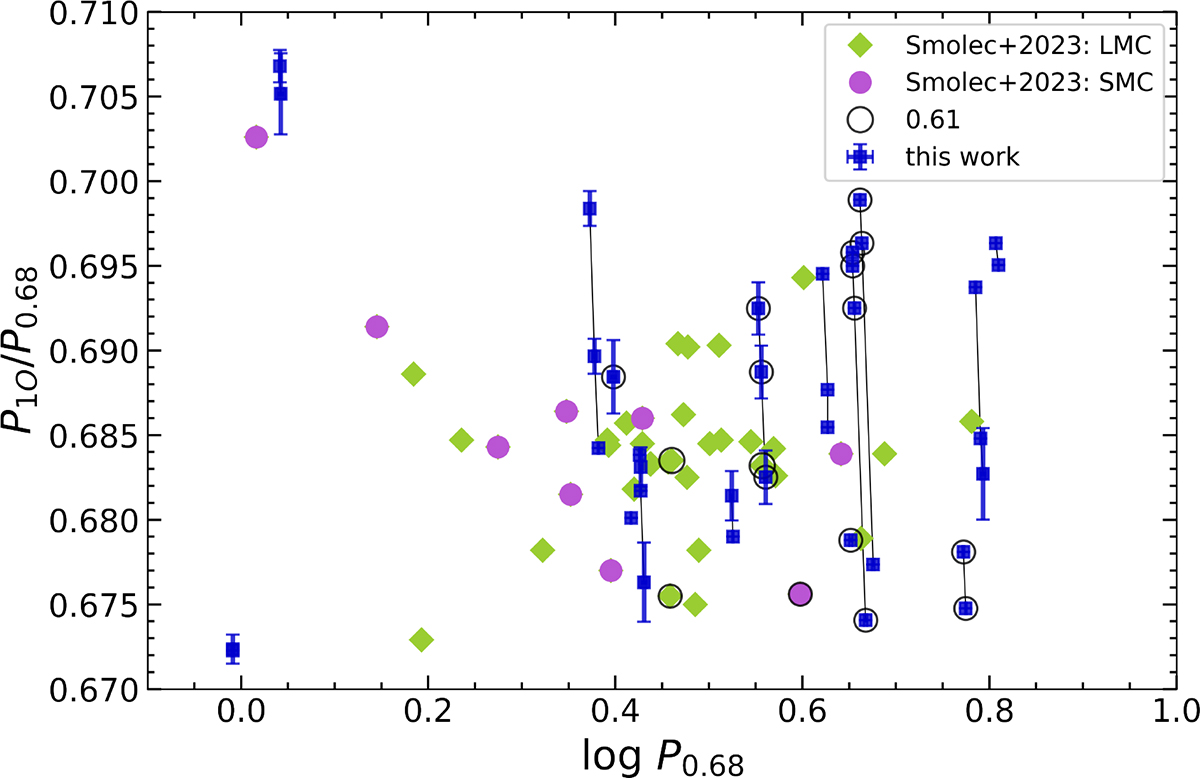
Petersen diagram of the 0.68 stars found in this work (blue squares) and by Smolec et al. (2023) in the same range of period ratios (green diamonds for the LMC and purple dots for the SMC). The values derived for the same stars, but from different sectors, are connected with black lines.
Current usage metrics show cumulative count of Article Views (full-text article views including HTML views, PDF and ePub downloads, according to the available data) and Abstracts Views on Vision4Press platform.
Data correspond to usage on the plateform after 2015. The current usage metrics is available 48-96 hours after online publication and is updated daily on week days.
Initial download of the metrics may take a while.