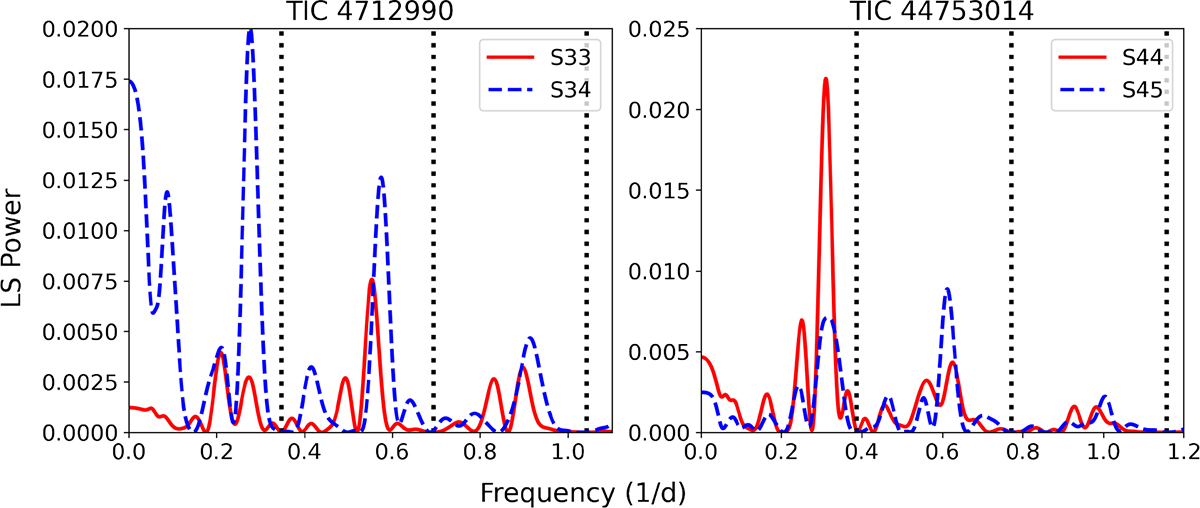
Fig. 8.
Download original image
Residual spectra for TIC 4712990 and TIC 44753014 after pre-whitening with the main pulsational frequency and its harmonics (f1O, 2f1O, and 3f1O marked with dotted black lines) computed from data of consecutive sectors (solid red and dashed blue lines). The figures demonstrate amplitude variations in the fsh and f0.61 detected on a short timescale.
Current usage metrics show cumulative count of Article Views (full-text article views including HTML views, PDF and ePub downloads, according to the available data) and Abstracts Views on Vision4Press platform.
Data correspond to usage on the plateform after 2015. The current usage metrics is available 48-96 hours after online publication and is updated daily on week days.
Initial download of the metrics may take a while.