Fig. 6
Download original image
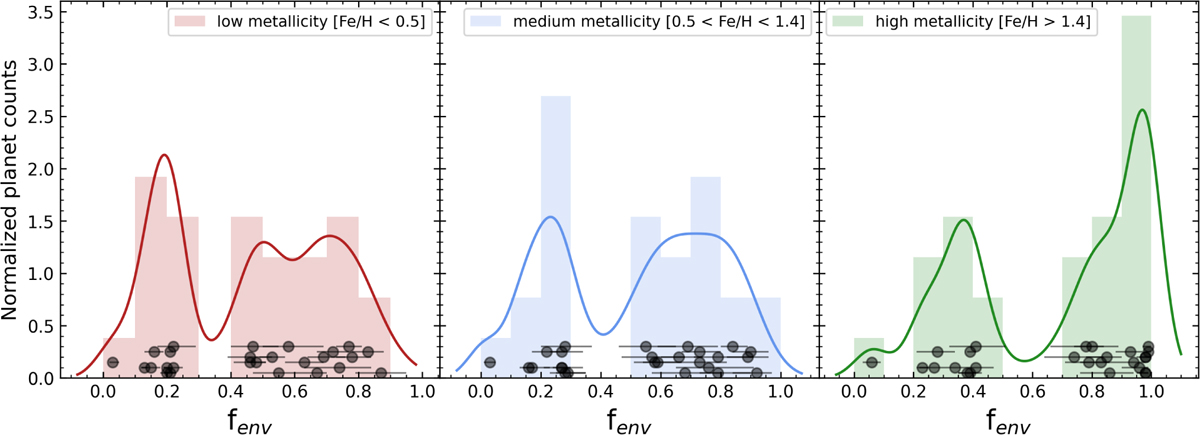
Histograms showing the fenv distribution for low (left panel), medium (middle panel), and high (right panel) atmospheric metallicities. The black points at the bottom are the inferred fenv values of the planets in our sample (distributed in the y-axis direction for visibility). The solid lines show an estimation of the probability density of the fenv distribution using kernel density estimation.
Current usage metrics show cumulative count of Article Views (full-text article views including HTML views, PDF and ePub downloads, according to the available data) and Abstracts Views on Vision4Press platform.
Data correspond to usage on the plateform after 2015. The current usage metrics is available 48-96 hours after online publication and is updated daily on week days.
Initial download of the metrics may take a while.