Fig. 1.
Download original image
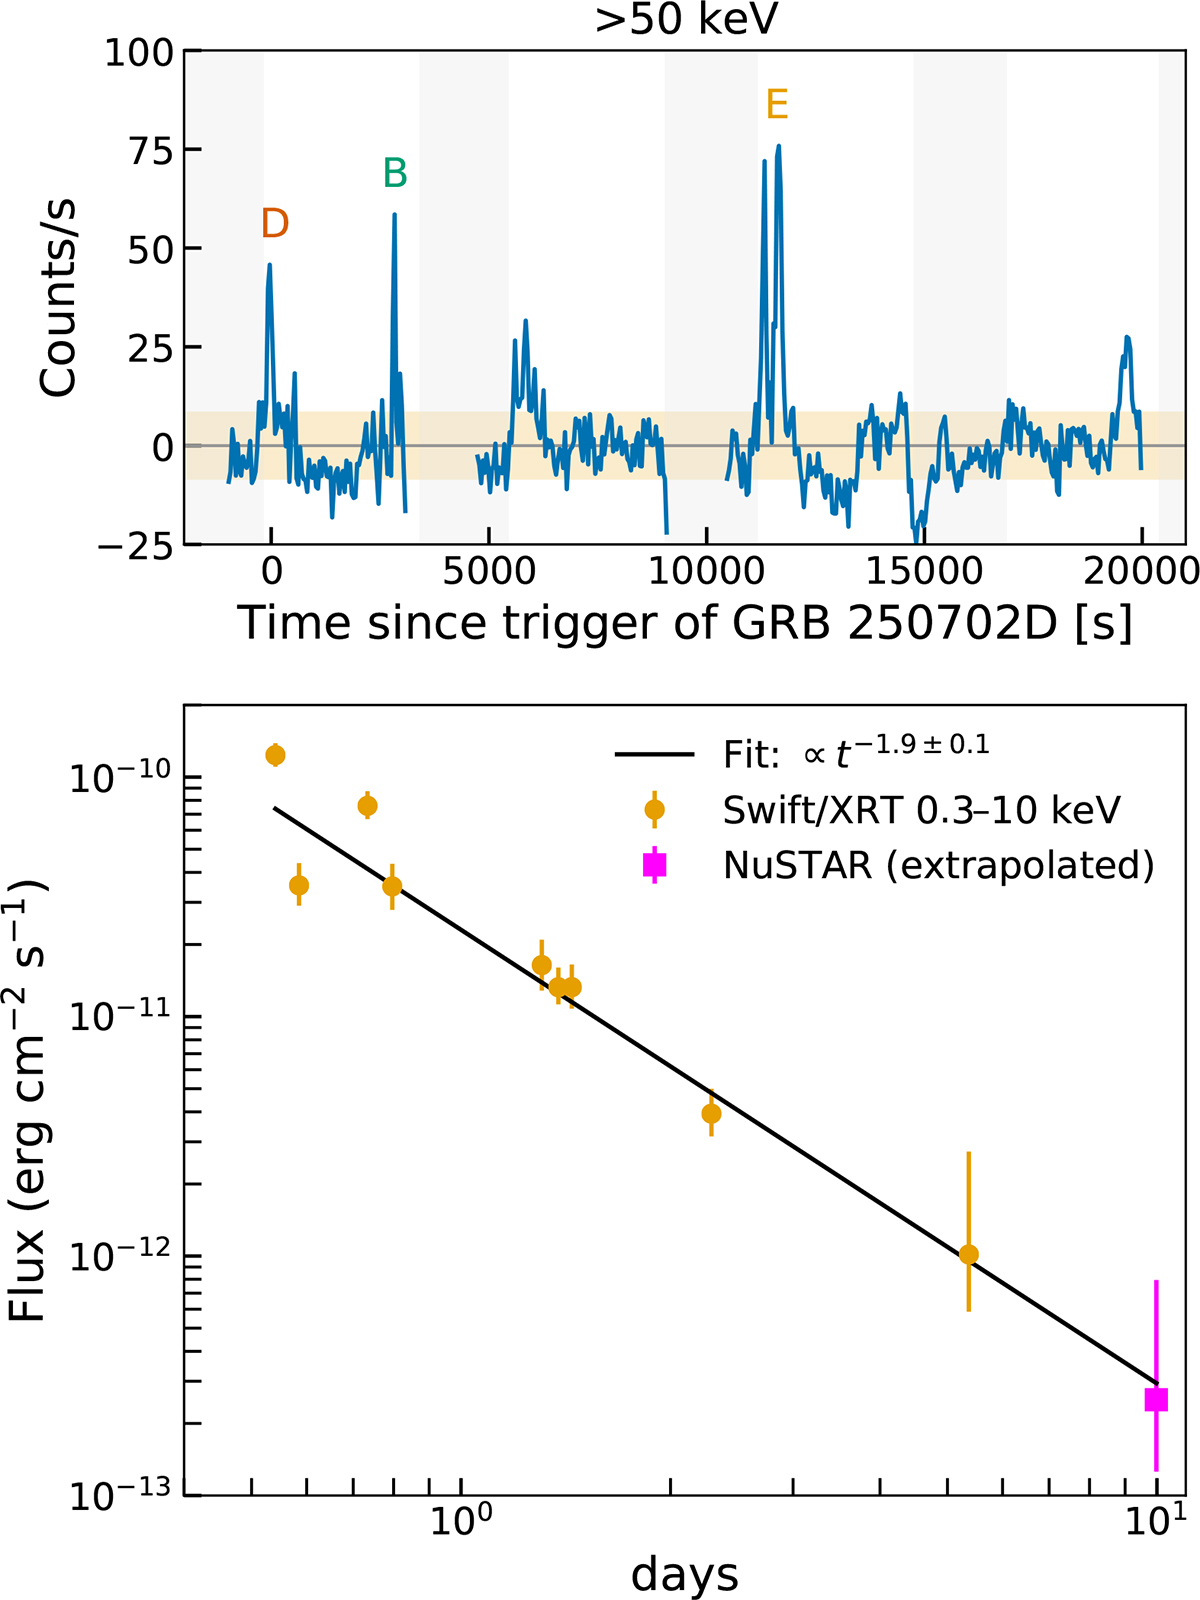
Upper panel: Background-subtracted 5 s-binned light curve of the hard X-rays/MeV emission detected by Fermi/GBM (50 − 900 keV). Gray shaded regions indicate time bins during which the source was occulted by the Earth. The yellow shaded region marks 1σ noise level in the light curve. Lower panel: Light curve of the soft X-ray counterpart obtained from time-resolved spectral analysis of Swift/XRT (0.3–10 keV, yellow circles). The flux at 0.3 − 10 keV at 10 days (pink square) was estimated by extrapolating the spectral model fitted to the NuSTAR data (fitted in the 3 − 30 keV range).
Current usage metrics show cumulative count of Article Views (full-text article views including HTML views, PDF and ePub downloads, according to the available data) and Abstracts Views on Vision4Press platform.
Data correspond to usage on the plateform after 2015. The current usage metrics is available 48-96 hours after online publication and is updated daily on week days.
Initial download of the metrics may take a while.