| Issue |
A&A
Volume 703, November 2025
|
|
|---|---|---|
| Article Number | L2 | |
| Number of page(s) | 9 | |
| Section | Letters to the Editor | |
| DOI | https://doi.org/10.1051/0004-6361/202556591 | |
| Published online | 31 October 2025 | |
Letter to the Editor
Ultra-long MeV transient from a relativistic jet: A tidal disruption event candidate
1
Gran Sasso Science Institute, Viale F. Crispi 7, L’Aquila (AQ) I-67100, Italy
2
INFN – Laboratori Nazionali del Gran Sasso, L’Aquila (AQ) I-67100, Italy
3
Cahill Center for Astronomy & Astrophysics, California Institute of Technology, Pasadena, CA 91125, USA
4
Max-Planck-Institut für Kernphysik, Saupfercheckweg 1, 69117 Heidelberg, Germany
5
University of Science and Teichnology of China, Hefei, Anhui, China
6
Tianfu Cosmic Ray Research Center 610000 Chengdu, China
7
Yerevan State University, 1 Alek Manukyan St, Yerevan 0025, Armenia
8
Department of Astronomy, Astrophysics and Space Engineering Indian Institute of Technology Indore, Simrol, Khandwa Road, Indore, 453552 Madhya Pradesh, India
9
Department of Astronomy and Astrophysics, The Pennsylvania State University, 525 Davey Lab, University Park, PA 16802, USA
10
Institute for Gravitation & the Cosmos, The Pennsylvania State University, University Park, PA 16802, USA
⋆ Corresponding authors: This email address is being protected from spambots. You need JavaScript enabled to view it.
; This email address is being protected from spambots. You need JavaScript enabled to view it.
; This email address is being protected from spambots. You need JavaScript enabled to view it.
Received:
24
July
2025
Accepted:
11
October
2025
Abstract
On July 2, 2025, the Gamma-ray Burst Monitor (GBM) on board the Fermi Gamma-ray space telescope detected three short-duration MeV transients with overlapping sky locations. These events, named as GRB 250702D, B, and E (collectively referred to as DBE), triggered the detector with delays of approximately 1 − 2 hours between each burst. Follow-up observations of this unusually long MeV transient (lasting more than 3 hours) by the Neil Gehrels Swift Observatory and the Nuclear Spectroscopic Telescope Array over a period of ∼10 days revealed a steep temporal decline in soft X-rays (∝t−1.9 ± 0.1). The time-averaged spectra during the outbursts are well described by a single power law, dNγ/dE ∝ E−1.5, while upper limits above 100 MeV imply a spectral cutoff between 10 MeV and 100 MeV. Using standard γ-ray transparency arguments, we derived a lower limit on the bulk Lorentz factor. Combined with the steep decline in X-rays, these constraints point to a relativistic jet origin. The properties of DBE are inconsistent with established GRB spectral–energy correlations, disfavoring classical long-GRB progenitors. Instead, the basic characteristics of DBE resemble those of previously reported jetted tidal disruption events (TDEs), though alternative progenitor channels cannot be excluded. In the relativistic TDE scenario, DBE is the first to have a MeV γ-ray emission detected. We argue that the observed emission is most likely produced by synchrotron radiation from sub-TeV electrons.
Key words: radiation mechanisms: non-thermal / relativistic processes / stars: black holes / stars: jets
© The Authors 2025
 Open Access article, published by EDP Sciences, under the terms of the Creative Commons Attribution License (https://creativecommons.org/licenses/by/4.0), which permits unrestricted use, distribution, and reproduction in any medium, provided the original work is properly cited.
This article is published in open access under the Subscribe to Open model. This email address is being protected from spambots. You need JavaScript enabled to view it. to support open access publication.
1. Introduction
The Gamma-ray Burst Monitor (GBM) on board the Fermi Gamma-ray Space Telescope detected and localized five Gamma-Ray Bursts (GRBs1) on July 2, 2025. Three of these MeV transients, namely GRB 250702D, B, and E (hereafter DBE), have overlapping sky positions, likely originating from the same source (Neights et al. 2025). The detection of hard X-ray emission from DBE was also reported by Konus-WIND (Frederiks et al. 2025), Swift-BAT/GUANO (DeLaunay et al. 2025), and the Space-based multi-band astronomical Variable Objects Monitor (SVOM; Svom/Grm Team 2025). Soft X-ray detections spatially coincident with DBE were reported by the Einstein Probe (EP 250702A; Cheng et al. 2025) and the Monitor of All-sky X-ray Image (Kawakubo et al. 2025) in observations preceding the first Fermi/GBM trigger.
Follow-up observations of EP 250702A/DBE by the X-Ray Telescope (XRT) on board the Neil Gehrels Swift Observatory (Swift, hereafter) revealed an associated fast-declining soft X-ray transient (∝t−2; Kennea et al. 2025). Observations by the Nuclear Spectroscopic Telescope Array (NuSTAR) in hard X-rays (3 − 79 keV), performed ∼1 day after the trigger of DBE, were consistent with the steep decline in soft X-rays (O’Connor et al. 2025). A similar rapid decline was observed in the near-infrared (NIR; Levan et al. 2025).
The duration of DBE in the MeV phase (> 3 hours) significantly exceeds the typical timescales of classical GRBs ( ). Its X-ray counterpart also evolves faster than typical GRB afterglows, where the luminosity decreases as ∝t−1 before the jet break time (Mészáros & Rees 1997), i.e., when 1/Γ ≪ θj, where Γ is the bulk Lorentz factor and θj is the opening angle of the jet. These two basic observables (i.e., the prolonged MeV γ-ray emission and the steep X-ray decline) make DBE a candidate for a relativistic tidal disruption event (TDE; Levan et al. 2025). The presence of hours-long outbursts preceding the classical steep decline phase suggests the formation of a relativistic jet. To date, only four relativistic TDEs have been identified: Swift J164449.3+573451 (Burrows et al. 2011; Bloom et al. 2011; Levan et al. 2011), Swift J2058.4+0516 (Cenko et al. 2012; Pasham et al. 2015), Swift J1112.2-8238 (Brown et al. 2015), and AT 2022cmc (Andreoni et al. 2022; Pasham et al. 2023). These events were detected up to hard X-rays (< 200 keV) but not in MeV γ-rays.
In this letter, we investigate the high-energy radiation associated with DBE from soft X-rays to γ-rays. We analyze each DBE outburst using publicly available data from Fermi/GBM (8 keV − 40 MeV) and the Fermi/Large Area Telescope (LAT, > 100 MeV). We also analyze the soft and hard X-ray emission of DBE in the first 10 days, provided by publicly available Swift/XRT observations and a dedicated NuSTAR Director’s Discretionary Time (DDT) observation obtained by our team. We then briefly discuss the properties of the emission region, where the non-thermal γ-ray photons are produced.
2. Temporal profile
We extracted the background-subtracted MeV light curve over a 5.5-hour interval following the trigger of 250702D (see the upper panel of Fig. 1 and Appendix A.1). The first two events, 250702D and 250702B, have similar durations of ∼100 − 150 s and are separated by a quiescent period of ∼45 minutes. A third associated burst, 250702E, occurred ∼3 hours later and lasted ∼600 s. Large parts of the intermediate temporal windows between these three events were not accessible due to Earth’s occultation. A weak emission episode at2 ∼ t0 + 6000 s originates from GRB 250702C (Fermi GBM Team 2025), which is not related to DBE (Neights et al. 2025).
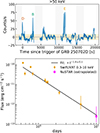 |
Fig. 1. Upper panel: Background-subtracted 5 s-binned light curve of the hard X-rays/MeV emission detected by Fermi/GBM (50 − 900 keV). Gray shaded regions indicate time bins during which the source was occulted by the Earth. The yellow shaded region marks 1σ noise level in the light curve. Lower panel: Light curve of the soft X-ray counterpart obtained from time-resolved spectral analysis of Swift/XRT (0.3–10 keV, yellow circles). The flux at 0.3 − 10 keV at 10 days (pink square) was estimated by extrapolating the spectral model fitted to the NuSTAR data (fitted in the 3 − 30 keV range). |
We performed a time-resolved spectral analysis of the soft X-ray emission observed by Swift/XRT (0.3 − 10 keV) and NuSTAR (Harrison et al. 2013) over the period from 0.5 to 10 days post trigger of 250702D. The details of the spectral analysis are presented in Appendix B. The X-ray light curve shows a steep temporal decline following t−1.9 ± 0.1 (lower panel of Fig. 1).
3. γ-ray spectra
We extracted the Fermi/GBM spectra during the three emission episodes (D, B, and E) from the daily GBM data. The background spectra for the short episodes (D and B) were estimated using standard polynomial fits to time intervals before and after each burst. To evaluate the background during the long-duration episode E, we adopted the average orbital method. Details of GBM data extraction and analysis are provided in Appendix A.2.
We first modeled the spectra of episodes D, B, and E using a simple power-law model, dN/dE ∝ E−α (Fig. 2). The best fit to the data in the energy range between 10 keV (40 keV for E) and 40 MeV provides α = 1.5 ± 0.1 for D and B and a slightly softer spectrum for E (α = 1.64 ± 0.04).
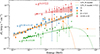 |
Fig. 2. Spectral energy distributions of events D, B, and E. The derived data points for the time-integrated spectra of D, B, and E along with the best-fit power-law models (with 1σ uncertainties) are shown using the blue, orange, and green symbols and shaded regions, respectively. The dashed orange and green lines represent average cutoff power-law models for the time-integrated spectra of events B and E. Upper limits between 100 MeV and 1 GeV (3σ) are shown as inverted triangles. The combined D and B spectrum above 200 keV along with its best-fit model (1σ) are shown using red triangles and a red shaded region. The corresponding spectral slopes (2 − α) are also indicated. |
We then tested for the presence of a high-energy softening by fitting the spectra with a cutoff power-law (CPL) model. We found no significant improvement in the fit compared to the simple power-law model. The cutoff energy was poorly constrained in all cases: Ecut > 4 MeV for D,  MeV for B, and Ecut > 14 MeV for E. We compared the best-fit CPL models with the 3σ upper limits from Fermi/LAT at 0.1 − 1 GeV (see Appendix C). These upper limits suggest that the cutoff energy should be between the GBM and LAT energy bands, i.e., 10 MeV < Ecut < 100 MeV. Our analysis shows that the time-resolved and time-integrated spectra of DBE are incompatible with the established spectral–energy correlations (Amati and Yonetoku relations) for long-duration GRBs (Appendix G).
The spectra of episodes D and B are consistent in normalization and spectral shape. Above 200 keV, the background is well characterized by the average orbital method. Thus, we extracted the cumulative D and B spectrum. Fitting it with a power-law model returned  , indicating a possible softening at high energies.
4. Discussion
The particularly long duration (> 3 hours) and variable MeV radiation is followed by a steep temporal decline in X-rays. The spectra in the MeV γ-rays are markedly different from those of classical GRBs. We found α ∼ 1.5 or softer in DBE, as opposed to α ∼ 1 in GRBs (Band et al. 1993). Moreover, the DBE spectra extend beyond ∼0.1 − 1 MeV, which is unusual for both short and long GRBs. The inferred photon index, α ∼ 1.5, can be produced by a cooled population of electrons with a distribution dNe/dγe ∝ γe−2. In Appendix D, we argue that the observed spectra are most likely produced by synchrotron radiation from sub-TeV electrons.
Provided the particularly long MeV duration and their spectral shape and together with the steep X-ray decline (0.5 − 10 days), we disfavor the origin via classical channels of formation of GRBs. During the tidal disruption of a star by a massive compact object, the fallback of stellar debris typically produces a flux decay ∝t−5/3 (Rees 1988). However, the X-ray spectra of DBE events are non-thermal, with photon indices between 1.4 and 1.6. The rapid X-ray decline may therefore be interpreted as afterglow emission from a forward shock once 1/Γ ≳ θj (Rhoads 1997) or alternatively as emission from a jet with diminishing power.
Several arguments have been put forward supporting the extragalactic origin of DBE (Levan et al. 2025), including its association with a candidate host galaxy of complex morphology. A transient relativistic jet formed as a consequence of the tidal disruption of a star by a compact object is a good candidate for long-duration MeV radiation. The previous four relativistic TDEs lack the emission in MeV γ-rays and were observed only up to hard X-rays (< 200 keV). The absence of associated MeV radiation can be due to the poor sensitivity of MeV instruments. In Appendix F, we compare the energetics as well as the temporal and spectral properties of DBE with those of previously reported relativistic TDE candidates. Although the sample size is limited, the X-ray variability, spectral shape, and energetics of DBE are consistent with those of the other candidates.
The individual outburst rise time and duration are linked to the density profile of the disrupted star and the mass of the compact object. It was previously argued that a variability timescale of ∼1000 s implies that the disrupted star is most probably a white dwarf (Krolik & Piran 2011). The disruption of a white dwarf requires that the mass of the compact object is < 105 M⊙. In the MeV γ-rays, DBE has an even shorter observed variability of ∼100 − 600 s, which indicates that the compact object is an intermediate mass black hole (Levan et al. 2025).
We estimate a lower limit on the bulk Lorentz factor of the jet, assuming that the DBE emission is subject to the usual MeV compactness constraint3:
![Mathematical equation: $$ \begin{aligned} \Gamma > \left[ \frac{ \eta (\beta ) \sigma _T \left( \frac{\epsilon _{\max }}{2} \right)^{2\beta - 1} (1+z)^{2\beta } d_L^2(z) F_0(1 - \beta ) }{ 2 \delta t_v m_e c^4 \left[ 1 - \left( \frac{\epsilon _0}{\epsilon _{\max }} \right)^{1 - \beta } \right] } \right]^{\frac{1}{4 + 2\beta }}, \end{aligned} $$](/articles/aa/full_html/2025/11/aa56591-25/aa56591-25-eq4.gif) (1)
(1)
where β ∼ 0.5 is the spectral index (Fν ∝ E−β, where β = α − 1); η(β) = 7/6(2 + β)(1 + β)5/3 (Svensson 1987); δtv ∼ 100 s is the observed variability timescale; ϵ0 ∼ 0.02 and ϵmax ∼ 78 are the minimum and maximum energies of the observed power-law spectrum in units of the electron rest mass; F0 ∼ 3 × 10⁻⁷ erg cm−2 s−1 is the flux integrated between ϵ0 and ϵmax; z and dL are the redshift and luminosity distance to the source, respectively.
In Fig. 3, we show the lower limit on the bulk Lorentz factor of the jet,  , as a function of the isotropic-equivalent outburst luminosity,
  , and source distance. We find that for Γ > 10, DBE is placed in the same category as the four previously reported jetted TDEs in terms of outburst luminosity.
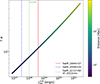 |
Fig. 3. Lower limit on the bulk Lorentz factor of the jet as a function of the isotropic-equivalent luminosity of the D and B emission episodes. The color bar indicates the corresponding luminosity distance to DBE. For comparison, we show the luminosity (brightest hard X-ray outbursts) measured for Swift J2058+05 (Cenko et al. 2012; Pasham et al. 2015), Swift J1112+82 (Brown et al. 2015), AT 2022cmc (Andreoni et al. 2022; Pasham et al. 2023), and Swift J1644+57 (Burrows et al. 2011) as dashed blue, dotted green, and solid red vertical lines. |
The total fluence emitted during the three episodes across ϵ0(∼0.02)−ϵmax(∼78) is ∼ 10−4 erg cm−2. Given the extension of the DBE spectra up to multi-MeV γ-rays (> 1 MeV), the MeV emission provides a reasonable approximation of the total radiative energy budget. In Fig. E.1, we show Γ as a function of isotropic-equivalent energy. To match the energetics of the previously reported jetted TDEs, a value of Γ ∼ 30 is required. Combining our constraints on the luminosity of individual outbursts and the total energy budget, we conclude that 10 < Γ < 30 and 100 Mpc < dL < 2 Gpc, consistent with the redshift constraints from the host galaxy (z < 1; Levan et al. 2025)4.
5. Conclusions
We have presented a temporal and spectral analysis of GRB 250702D/B/E (DBE), three MeV transients with durations of 100 − 600 s separated by ∼1 − 3 hours. The spatial coincidence of these events indicates a common origin, suggesting ultra-long central engine activity lasting more than 3 hours. Our findings are summarized as follows:
-
The prolonged MeV emission and the subsequent steep decline in the X-ray light curve in the first 10 days are different from classical GRBs, pointing instead to a TDE involving a relativistic jet.
-
All three γ-ray episodes exhibit soft power-law spectra with indices α (dN/dE ∝ E−α) ranging between 1.5 and 1.7 over the 10 KeV − 40 MeV band, which is inconsistent with classical GRBs.
-
The time-resolved and time-integrated spectra are inconsistent with the Yonetoku and Amati spectral–energy relations for long GRBs.
-
The spectra of episodes D and B, separated by ∼45 minutes, are consistent in spectral shape and normalization.
-
No significant high-energy cutoff is found for time-averaged spectra within the 10 KeV − 40 MeV range.
-
The Fermi/LAT (E > 100 MeV) upper limits during the B and E episodes suggest that the spectrum softens between 10 − 100 MeV. The combined D+B spectrum above 200 keV further supports the presence of a high-energy softening.
-
The constraints on the bulk Lorentz factor, variability, spectral shape, and energetics make DBE consistent with the properties of four previously reported jetted TDEs.
If DBE originated from a jetted TDE, it would represent the first such event with detected MeV emission. We argue that the observed spectra are most likely produced by synchrotron radiation from sub-TeV electrons.
Not all short-lasting MeV transients named as GRBs upon their trigger originate from classical GRB progenitors, such as collapsars and binary neutron star mergers.
We note that t0 is defined as the trigger time of 250702D on 2025-07-02 13:09:02.03 (UT).
Similar constraints were applied to classical GRBs in Ruderman (1975), Schmidt (1978), Lithwick & Sari (2001). See Ravasio et al. (2024) for more detailed derivations.
In these estimates, we assume the jet is viewed on-axis. However, some TDE jets may be misaligned to account for late-time radio afterglow observations (Beniamini et al. 2023). If the DBE jet is misaligned, then the true Lorentz factor could be even larger.
Acknowledgments
We thank the anonymous referee for the suggestions that have improved this letter. We thank M.E. Ravasio, P. Blasi, P. Jonker and A. Levan for the fruitful discussions. We thank Fiona Harrison, PI of NuSTAR, and the NuSTAR SOC team for scheduling the requested DDT observation. B.B. acknowledges financial support from the Italian Ministry of University and Research (MUR) for the PRIN grant METE under contract no. 2020KB33TP. S.R., M.B. and G.O. acknowledge the ACME project, which has received funding from the European Union’s Horizon Europe Research and Innovation program under Grant Agreement No. 101131928. F.A. acknowledges support from the Sichuan Science and Technology Department (under grant number 2024JDHJ0001). This research has made use of data obtained through the High Energy Astrophysics Science Archive Research Center Online Service, provided by the NASA/Goddard Space Flight Center, and specifically, this work made use of public Fermi-GBM and Fermi-LAT data. This work made use of data supplied by the UK Swift Science Data Centre at the University of Leicester. This research is based on observations obtained with NuSTAR, a project led by the California Institute of Technology, managed by the Jet Propulsion Laboratory, and funded by the National Aeronautics and Space Administration. Data analysis was performed using the NuSTAR Data Analysis Software (NuSTARDAS), jointly developed by the ASI Science Data Center (SSDC, Italy) and the California Institute of Technology (USA).
References
- Amati, L., Frontera, F., Tavani, M., et al. 2002, A&A, 390, 81 [NASA ADS] [CrossRef] [EDP Sciences] [Google Scholar]
- Andreoni, I., Coughlin, M. W., Perley, D. A., et al. 2022, Nature, 612, 430 [CrossRef] [PubMed] [Google Scholar]
- Arnaud, K. A. 1996, in Astronomical Data Analysis Software and Systems V, eds. G. H. Jacoby, & J. Barnes, ASP Conf. Ser., 101, 17 [NASA ADS] [Google Scholar]
- Band, D., Matteson, J., Ford, L., et al. 1993, ApJ, 413, 281 [Google Scholar]
- Beniamini, P., Piran, T., & Matsumoto, T. 2023, MNRAS, 524, 1386 [Google Scholar]
- Biltzinger, B., Kunzweiler, F., Greiner, J., Toelge, K., & Burgess, J. M. 2020, A&A, 640, A8 [NASA ADS] [CrossRef] [EDP Sciences] [Google Scholar]
- Bloom, J. S., Giannios, D., Metzger, B. D., et al. 2011, Science, 333, 203 [CrossRef] [PubMed] [Google Scholar]
- Brown, G. C., Levan, A. J., Stanway, E. R., et al. 2015, MNRAS, 452, 4297 [NASA ADS] [CrossRef] [Google Scholar]
- Burrows, D. N., Kennea, J. A., Ghisellini, G., et al. 2011, Nature, 476, 421 [NASA ADS] [CrossRef] [Google Scholar]
- Cenko, S. B., Krimm, H. A., Horesh, A., et al. 2012, ApJ, 753, 77 [NASA ADS] [CrossRef] [Google Scholar]
- Cheng, H. Q., Zhao, G. Y., Zhou, C., et al. 2025, GRB Coordinates Network, 40906, 1 [Google Scholar]
- De Santis, A. L. 2024, Orbital Subtraction Tool - GBM [Google Scholar]
- DeLaunay, J., Ronchini, S., Tohuvavohu, A., et al. 2025, GRB Coordinates Network, 40903, 1 [Google Scholar]
- Fermi GBM Team 2025, GRB Coordinates Network, 40885, 1 [Google Scholar]
- Fitzpatrick, G., Connaughton, V., McBreen, S., & Tierney, D. 2011, arXiv e-prints [arXiv:1111.3779] [Google Scholar]
- Frederiks, D., Lysenko, A., Ridnaia, A., et al. 2025, GRB Coordinates Network, 40914, 1 [Google Scholar]
- Goldstein, A., Cleveland, W. H., & Kocevski, D. 2022, Fermi GBM Data Tools: v1.1.1 [Google Scholar]
- Harrison, F. A., Craig, W. W., Christensen, F. E., et al. 2013, ApJ, 770, 103 [Google Scholar]
- Kaastra, J. S., & Bleeker, J. A. M. 2016, A&A, 587, A151 [NASA ADS] [CrossRef] [EDP Sciences] [Google Scholar]
- Kawakubo, Y., Serino, M., Negoro, H., et al. 2025, GRB Coordinates Network, 40910, 1 [Google Scholar]
- Kennea, J. A., Siegel, M. H., Evans, P. A., et al. 2025, GRB Coordinates Network, 40919, 1 [Google Scholar]
- Krolik, J. H., & Piran, T. 2011, ApJ, 743, 134 [NASA ADS] [CrossRef] [Google Scholar]
- Levan, A. J., Tanvir, N. R., Cenko, S. B., et al. 2011, Science, 333, 199 [NASA ADS] [CrossRef] [Google Scholar]
- Levan, A. J., Martin-Carrillo, A., Laskar, T., et al. 2025, ApJ, 990, L28 [Google Scholar]
- Lithwick, Y., & Sari, R. 2001, ApJ, 555, 540 [NASA ADS] [CrossRef] [Google Scholar]
- Meegan, C., Lichti, G., Bhat, P. N., et al. 2009, ApJ, 702, 791 [Google Scholar]
- Mészáros, P., & Rees, M. J. 1997, ApJ, 476, 232 [CrossRef] [Google Scholar]
- Nava, L., Salvaterra, R., Ghirlanda, G., et al. 2012, MNRAS, 421, 1256 [Google Scholar]
- Neights, E., Roberts, O. J., Burns, E., et al. 2025, GRB Coordinates Network, 40931, 1 [Google Scholar]
- O’Connor, B., Pasham, D., Andreoni, I., & Hare, J. 2025, GRB Coordinates Network, 41014, 1 [Google Scholar]
- Pasham, D. R., Cenko, S. B., Levan, A. J., et al. 2015, ApJ, 805, 68 [Google Scholar]
- Pasham, D. R., Lucchini, M., Laskar, T., et al. 2023, Nat. Astron., 7, 88 [Google Scholar]
- Piran, T. 1999, Phys. Rep., 314, 575 [NASA ADS] [CrossRef] [Google Scholar]
- Ravasio, M. E., Ghirlanda, G., & Ghisellini, G. 2024, A&A, 685, A166 [NASA ADS] [CrossRef] [EDP Sciences] [Google Scholar]
- Rees, M. J. 1988, Nature, 333, 523 [Google Scholar]
- Rhoads, J. E. 1997, ApJ, 487, L1 [NASA ADS] [CrossRef] [Google Scholar]
- Ruderman, M. 1975, in Seventh Texas Symposium on Relativistic Astrophysics, eds. P. G. Bergman, E. J. Fenyves, & L. Motz, 262, 164 [Google Scholar]
- Schmidt, W. K. H. 1978, Nature, 271, 525 [Google Scholar]
- Svensson, R. 1987, MNRAS, 227, 403 [NASA ADS] [Google Scholar]
- Svom/Grm Team (Wang, C.-W., et al.) 2025, Network, 40923, 1 [Google Scholar]
- Yonetoku, D., Murakami, T., Nakamura, T., et al. 2004, ApJ, 609, 935 [Google Scholar]
Appendix A: Fermi GBM data analysis
A.1. Orbital background estimate
To accurately estimate the background for the three observed γ-ray transients, we employed a modified version of the OSV tool (De Santis 2024; Fitzpatrick et al. 2011). This method leverages the periodic orbital characteristics of the Fermi satellite. Fermi operates in 90-minute orbits and performs a rocking maneuver every two orbits to ensure full-sky coverage (Meegan et al. 2009). This pattern results in the satellite returning to the exact same celestial position every 15 orbits, and to the same position with identical pointing every 30 orbits. The OSV tool exploits this by estimating the background for long or faint MeV sources as the mean event rate observed by the Gamma-ray Burst Monitor (GBM) 15 or 30 orbits before and after the time of interest.
For the binned data, the background estimate Rbck(ti, Ei) for an observed rate R(ti, Ei) in a specific time and energy bin “i” is given by
 (A.1)
(A.1)
This formula applies to the 15-orbit scenario. For the 30-orbit scenario, the time difference becomes larger. Furthermore, averaging over 14 and 16 orbits also provides a robust background estimate (Fitzpatrick et al. 2011). This is attributed to the near-identical detector position and pointing angles at these orbital intervals.
It is crucial to note that the effectiveness of the 15-orbit method for background estimation, particularly above 40 keV, is enhanced by the energy cutoff. Many potential point sources, which could introduce contamination, contribute predominantly below 100 keV (Biltzinger et al. 2020). Consequently, for the majority of our energy bins, the position of the detectors is the dominant factor influencing the background, rather than subtle pointing variations.
Figure A.1 illustrates the background estimates for the primary time intervals for detectors “nb” and “b1.” A qualitative validation of the background estimation can be done by comparing the predicted and measured rates in regions immediately adjacent to the signal. A close match indicates a valid background estimate.
Analysis of the data reveals that the background estimated using the 30-orbit method generally aligns well with the measured rates. The sole exception is detector “nb” during GRB B, where the 30-orbit estimate clearly overestimates the background. In this specific case, the 15-orbit estimate provides a much more accurate representation of the pre- and post-burst background.
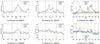 |
Fig. A.1. Light curves for two detectors (Detector nb: top row; Detector b1: bottom row) across three different events (Event 1: left column; Event 2: middle column; Event 3: right column). The estimated background is plotted using three different orbits. For the “nb” data, the energy range is cut between 40 keV and 900 keV, while for “b1” data, the cut is between 200 keV and 40 MeV. Each panel shows the light curve integrated over energy for a specific detector and event combination. |
A.2. Spectral analysis
We first verified that during the temporal bins of the D, B, and E events, only one sodium iodide detector (nb) and one bismuth germanate detector (b1) satisfy the source-to-detector angle cuts. We downloaded the daily data for July 2, 2025, from the Fermi GBM Daily Data online repository5. To analyze the time bins of interest, we generated response matrices using the GBM Response Generator6, based on the position provided by Swift/XRT. We identify the D, B, and E outburst times as −100–50 s, 2750–2850 s, and 11200–11800 s, respectively, since the trigger time of GRB 250702D (2 July 13:09:02.03 UT). We extracted the spectra from GBM daily data using the publicly available Fermi GBM Data Tools (Goldstein et al. 2022).
We tested two methods to estimate the background spectrum during the D, B, and E intervals (see below). The first method extrapolates a polynomial function fitted to pre- and post-burst intervals, allowing background estimation over the full Fermi/GBM energy range (10 KeV − 40 MeV). The second method uses the average orbital background, which lacks coverage below 40 keV. The results of the spectral modeling are presented in Table A.1. We note that all spectral fits presented in this work are performed using XSPEC (Arnaud 1996), and assuming Cash statistics (C-stat).
A.2.1. Spectra of events D and B
The duration of the D event is short (∼150 s), so we estimate the background using both the standard polynomial fit to off-source intervals (−300 to −200 s and 150 to 250 s), and the orbital background method (above 40 keV). The model parameters from both methods are consistent within uncertainties. We report the photon index and flux (10 keV– 40 MeV) for the power-law model, and the cutoff energy Ecut for the cutoff power-law model. We do not observe a significant statistical improvement from introducing a high-energy cutoff (Δ stat = −4, for one additional free parameter).
Similarly to D, event B also has a short duration (∼150 s), so both background estimation methods are applied, yielding comparable results. For wider energy coverage, we use the standard off-source intervals (2350–2550 s and 3000–3055 s). The cutoff power-law model gives only a marginal improvement in fit quality (Δ stat = −14, for one additional free parameter).
Given that the background at the highest energies (> 200 keV) is well described by the orbital method, and that the detector response remains stable between events D and B, we estimate the cumulative D+B spectrum (> 200 keV, detector b1) for improved spectral characterization. The corresponding power-law fit is included in Table A.1.
A.2.2. Spectrum of event E
The E outburst lasts at least 600 s. Therefore, we adopted the orbital background method (30 orbits). We model the spectrum using both power-law and cutoff power-law models. The latter does not significantly improve the spectral characterization in the 40 keV − 40 MeV range (Δstat = 1).
Spectral fit results for selected time bins using power-law and cutoff power-law models.
Appendix B: X-rays
B.1. Swift/XRT data analysis
To extract the spectra, we downloaded the XRT event files from the Swift-XRT archive7. We extracted source and background spectra in each time bin using the xselect tool. For each time bin, the ancillary response has been generated by xrtmkarf. We then model 9 spectra with an absorbed power-law model with two neutral hydrogen absorbers: one fixed to Galactic the equivalent hydrogen column density at NH = 0.207 × 1022 cm−2 and the other at the host galaxy. We have adopted 4 different redshifts for the host galaxy: 0, 0.5, 1 and 2. The equivalent hydrogen column density in the host galaxy is best fitted by  ,
,  ,
,  , and
, and  . We have verified that the inferred unabsorbed flux is not affected by the choice of the redshift. And so, we report the unabsorbed 0.3 − 10 keV flux (z = 0) and the photon index in the Table B.1.
Result of the time-resolved spectral analysis of Swift/XRT data.
B.2. NuSTAR data analysis
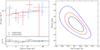 |
Fig. B.1. Left: NuSTAR FPMA and FPMB (blue and red, respectively) spectra fitted with a power-law model. Right: Confidence contours (68%, 95%, and 99%) of the photon index versus the 3 − 30 keV flux. |
A NuSTAR (Harrison et al. 2013) DDT observation of DBE took place on 2025 July 12 (ObsID 91101324002; PI: E. Kammoun) for a total exposure of 39 ks. The data were reduced using the standard pipeline in the NuSTAR Data Analysis Software (NUSTARDAS V2.1.4), and using CalDB20250521. We cleaned the unfiltered event files with the standard depth correction. We reprocessed the data using the saamode = strict, saacalc = 3, and tentacle = yes criteria for a more conservative treatment of the high background levels near the South Atlantic Anomaly. Due to the high background activity during the observation, this filtering scheme reduced our net exposure time to 31.7 ks and 32.8 ks, for the two focal plane modules (FPMA and FPMB), respectively. We extracted the source spectra from a circular region of radius 40″ centered at the coordinates of the source, using the HEASOFT task nuproducts. Background spectra were extracted from a source-free region of radius 80″. We analyze the spectra from FPMA and FPMB jointly, without combining them. The NuSTAR spectra were binned using the ftool ftgrouppha with grouptype=optmin and groupscale = 25. This sets up a binning using optimal binning as described by Kaastra & Bleeker (2016), but with the additional requirement of a minimum number of 25 counts per bin.
We modeled the NuSTAR spectra in the 3 − 30 keV range using XSPEC. We assumed an absorbed power law, by fixing the equivalent hydrogen column density at NH = 1022 cm−2 (assumed at z = 0, consistent with the analysis of Swift/XRT). We let the photon index and the normalization free to vary. This model results in a statistically good fit (C/dof = 5/7) with a photon index of  and 3 − 30 keV flux log F3 − 30 = −12.66 ± 0.14. Extrapolating the best fit to the Swift/XRT soft band results in an unabsorbed flux in the 0.3 − 10 keV range of
  . The left panel of Fig. B.1 shows the NuSTAR spectra with the best-fit model. The right panel of the same figure shows the photon index versus flux contours.
Appendix C: Fermi/LAT
We performed unbinned likelihood analysis of Fermi/LAT data for the γ-ray burst, starting from the 5 ks before the Fermi/GBM trigger time of GRB 250702D (t0 = 773154547 s MET) and expanding up to t0+15 ks seconds, in the energy range of 0.1–1 GeV, using the GTBURST8 software from Fermi Science tool. We selected the region of interest covering 12° around the source location R.A. = 284.69°, Dec=-7.87° (J2000) consistent with the Swift/XRT and EP observations (Cheng et al. 2025; Kennea et al. 2025). A standard zenith angle (Zd) cut of 100° is applied to remove any contamination of photons from the Earth-limb. We used the P8R3_TRANSIENT020 event class, which is suitable for the analysis of transient sources, and the corresponding instrument response functions. The isotropic particle background (‘isotr template’ in GTBURST), galactic and extragalactic high-energy components of the Fermi Fourth Catalog (4FGL), with fixed normalization (‘template (fixed norm)’) has been used. No significant emission during the transients was detected. We estimated a 3σ (99.7%) upper-limit of the energy-flux while fitting a power-law (‘powerlaw2’ spectral model using GTBURST).
In addition, we computed the probability of association of photons with the burst in the given time interval using the gtsrcprob module in an energy range of 0.1-100 GeV. Figure C.1 shows the photons detected by LAT during this period and the probability of photons associated with the transient. We detected only a single photon with an energy of 1.85 GeV with a probability greater than 88% of being associated with the source.
Due to the unavailability of good quality data during GRB 250702D (not satisfying Zd cut; Zd> 100°), and no high-energy photons registered by LAT (even if the observation condition of Zd< 100° was satisfied) during GRB 250702B and GRB 250702E (see Tab. A.1 and Fig.C.1), we selected a time-range starting from −4800 s before the trigger to derive the flux upper-limits for two different durations of 100 s and 300 s (see Tab. C.1) in the energy range 0.1-1 GeV.
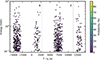 |
Fig. C.1. Gigaelectron volt photon detected by LAT from the location of GRB 250702D/B/E and probability of association with the transient. The figure shows the time-windows in which high-energy photons were detected by LAT from the transient location. The color bar represents the probability of association of photons to the transient detected during t0 − 5 ks to t0 + 15 ks. The gray shaded region represents GRB 250702B/E. Note that LAT observed event E for approximately half of its duration. Thus, the time interval marked by the shaded region corresponds to time when LAT covered the transient. |
Upper limits in the 0.1 − 1 GeV range at the 3σ level.
Appendix D: Physical constraints
We briefly discuss the possibility that the observed γ-ray emission is produced through synchrotron and inverse Compton radiation by a population of cooled electrons. The properties of the emission region can be constrained by requiring that (i) the radiative cooling time is shorter than the dynamical time, and (ii) the jet has a high radiative efficiency (i.e., a large fraction of the jet energy is converted into MeV γ-rays).
Producing the observed emission through synchrotron radiation requires electron Lorentz factors γe ∼ 107Γ1−1/2(ϵ/ϵmax)1/2B′ − 1/2, where B′ is the magnetic field in the comoving frame of the emission region and Γ1 = Γ/10. The synchrotron cooling time scale, t′sync ∼ 6πmec/γeB′2σT ∼ 80 Γ11/2(ϵ/ϵmax)−1/2B′ − 3/2 s should be shorter than the dynamical time in the comoving frame,  , where R ∼ Γ2cδtv is the distance from the compact object where the γ-ray emission is produced and δt2 = δtv/100 s. For ϵ = ϵ0 ∼ 2.6 × 10⁻⁴ϵmax, the condition t′sync < t′dyn implies
  . The jet Poynting flux, LB ∼ cΓ2B′2R2, should be smaller than the isotropic-equivalent outburst luminosity, Liso. The condition LB < Liso implies
  , where L48 ∼ Liso/1048 erg s−1. Therefore, a population of sub-TeV electrons (5 × 10³ Γ1−1/2B3′ − 1/2 < γe < 3 × 10⁵ Γ1−1/2B3′ − 1/2, where B3′=B′/103 G) can account for the observed spectra of DBE. The maximum energy of electrons can be roughly estimated by requiring the acceleration time
  to be compatible with
  , where rL is the Larmor radius of an electron. As a result,
  , and for η ∼ 1 we obtain
  , which is consistent with our earlier requirement based on radiative efficiency.
Producing the observed MeV radiation via inverse Compton scattering is complicated. To maintain a high radiative efficiency in MeV γ-rays, the lowest-energy electrons should scatter the lowest-energy observed photons (ϵ = ϵ0, which corresponds to an energy ∼10 keV) in the Klein-Nishina regime. Then, the Lorentz factor of the lowest-energy electrons should be γe > 5 × 10² Γ1. The Lorentz factor of the highest-energy electrons should be γe > 3 × 10⁴ Γ1 because ϵmax/ϵ0 ∼ 4 × 10³. Therefore, seed photons should have energies  eV. In the external inverse Compton scenario, it is difficult to produce far-infrared photons from the accretion disk. In the synchrotron self-Compton scenario, one would need an unreasonably low magnetic field,
  .
.
Appendix E: Isotropic-equivalent energy
Figure E.1 shows the lower limit on the bulk Lorentz factor of the jet as a function of the isotropic-equivalent energy released during the three emission episodes. These lower limits are inferred from two independent methods: γ–γ absorption (circles) and constraints from the deceleration time of the X-ray afterglow emission. The latter is estimated using the standard deceleration time condition in a uniform circumburst medium,  (Piran 1999), where n0 is the number density of the circumburst medium, E0 is the isotropic-equivalent kinetic energy of the jet, and tp, z is the afterglow peak time in the source rest frame. For the limits shown here, we assume a radiative efficiency of 10% for the prompt MeV emission, n0 = 1 cm−3, and tp < 0.5 days.
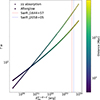 |
Fig. E.1. Lower limit on the bulk Lorentz factor as a function of the isotropic-equivalent energy released during all three episodes. The lower limits are determined using two methods: the afterglow deceleration time (squares) and γ–γ absorption (circles). The color bar indicates the corresponding luminosity distance to DBE. For comparison, we show total isotropic-equivalent energy measured for Swift J2058+05 (Cenko et al. 2012; Pasham et al. 2015) and Swift J1644+57 (Burrows et al. 2011) as dashed blue and red vertical lines. |
Appendix F: Comparison with other relativistic TDE candidates
In Table F.1, we summarize the properties of four previously reported relativistic TDE candidates, along with the DBE event. The characteristics of DBE closely resemble those of these events in terms of X-ray temporal decline, spectral index, peak luminosity, and isotropic-equivalent energy. All of the sources have been detected in hard X-rays (15–150 keV), with the exception of AT2020cmc. The typical variability timescale of DBE (∼100 s) is comparable to the shortest variability reported for Swift J1644+57 (∼100 s) and Swift J2058+05 (∼500 s). Estimates of the bulk Lorentz factor in TDE jets are often model dependent but generally fall within the range 2–90.
Properties of relativistic TDE candidates.
Appendix G: Comparison with spectral-energy correlations of GRBs
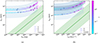 |
Fig. G.1. Comparison of the intrinsic properties of DBE, computed for different redshifts, with the Amati relation (a) and the Yonetoku relation (b). The green line in each panel shows the corresponding relation, with the green-shaded area indicating its 3σ scatter. The colored lines display Ep, z as a function of Eiso (left) and Liso (right), computed for spectra D, B, and E (distinguished by line style) as a function of z, encoded by the color map. Circles on top of each curve denote reference redshift values, z = 0.1, 1, 2. The blue-shaded bands indicate the 1σ confidence intervals (for spectrum B in the left panel; for spectra D, B, and E in the right panel), while the blue dots denote regions corresponding to lower limits on the fitted Ep (for D, E, and D+B+E in the left panel). |
We tested the consistency of DBE with the known spectral-energy correlations of long GRBs: the Ep, z - Eiso Amati relation (Amati et al. 2002), which holds for time-integrated prompt spectra, and the Ep, z - Liso Yonetoku relation (Yonetoku et al. 2004), which is valid for the peak prompt emission spectra. Starting from the results of our time-integrated analysis with the CPL model (Table A.1), we computed the isotropic equivalent energy, Eiso, and the rest-frame peak energy, Ep, z, for the three events, considering a range of redshift values z ∈ [0.01, 5]. We also computed these quantities for the total duration of the event (denoted D+B+E), adopting as Ep the most conservative fitted value, namely that of spectrum D. The results are shown in Fig. G.1a, together with the 3σ scatter region around the Amati relation adopted from Nava et al. (2012). To investigate the Ep, z - Liso correlation, we extracted the 5-second peak spectrum obtained from the 5-second binning GBM light curve of each event, and fitted each of them with the CPL model to constrain the peak energy. We obtained  and
and  for spectrum D,
  and
and  from spectrum B, and
  and
and  for spectrum E, which corresponds to the brightest peak of the entire DBE event. Analogously, we computed the isotropic equivalent luminosity, Liso, and Ep, z, for different redshifts. The results are shown in Fig. G.1b, together with the 3σ scatter region around the Yonetoku relation adopted from Nava et al. (2012). It is evident that the three events lie outside both the spectral-energy correlations that characterize long-duration GRBs.
All Tables
Spectral fit results for selected time bins using power-law and cutoff power-law models.
All Figures
|
Fig. 1. Upper panel: Background-subtracted 5 s-binned light curve of the hard X-rays/MeV emission detected by Fermi/GBM (50 − 900 keV). Gray shaded regions indicate time bins during which the source was occulted by the Earth. The yellow shaded region marks 1σ noise level in the light curve. Lower panel: Light curve of the soft X-ray counterpart obtained from time-resolved spectral analysis of Swift/XRT (0.3–10 keV, yellow circles). The flux at 0.3 − 10 keV at 10 days (pink square) was estimated by extrapolating the spectral model fitted to the NuSTAR data (fitted in the 3 − 30 keV range). |
| In the text | |
|
Fig. 2. Spectral energy distributions of events D, B, and E. The derived data points for the time-integrated spectra of D, B, and E along with the best-fit power-law models (with 1σ uncertainties) are shown using the blue, orange, and green symbols and shaded regions, respectively. The dashed orange and green lines represent average cutoff power-law models for the time-integrated spectra of events B and E. Upper limits between 100 MeV and 1 GeV (3σ) are shown as inverted triangles. The combined D and B spectrum above 200 keV along with its best-fit model (1σ) are shown using red triangles and a red shaded region. The corresponding spectral slopes (2 − α) are also indicated. |
| In the text | |
|
Fig. 3. Lower limit on the bulk Lorentz factor of the jet as a function of the isotropic-equivalent luminosity of the D and B emission episodes. The color bar indicates the corresponding luminosity distance to DBE. For comparison, we show the luminosity (brightest hard X-ray outbursts) measured for Swift J2058+05 (Cenko et al. 2012; Pasham et al. 2015), Swift J1112+82 (Brown et al. 2015), AT 2022cmc (Andreoni et al. 2022; Pasham et al. 2023), and Swift J1644+57 (Burrows et al. 2011) as dashed blue, dotted green, and solid red vertical lines. |
| In the text | |
|
Fig. A.1. Light curves for two detectors (Detector nb: top row; Detector b1: bottom row) across three different events (Event 1: left column; Event 2: middle column; Event 3: right column). The estimated background is plotted using three different orbits. For the “nb” data, the energy range is cut between 40 keV and 900 keV, while for “b1” data, the cut is between 200 keV and 40 MeV. Each panel shows the light curve integrated over energy for a specific detector and event combination. |
| In the text | |
|
Fig. B.1. Left: NuSTAR FPMA and FPMB (blue and red, respectively) spectra fitted with a power-law model. Right: Confidence contours (68%, 95%, and 99%) of the photon index versus the 3 − 30 keV flux. |
| In the text | |
|
Fig. C.1. Gigaelectron volt photon detected by LAT from the location of GRB 250702D/B/E and probability of association with the transient. The figure shows the time-windows in which high-energy photons were detected by LAT from the transient location. The color bar represents the probability of association of photons to the transient detected during t0 − 5 ks to t0 + 15 ks. The gray shaded region represents GRB 250702B/E. Note that LAT observed event E for approximately half of its duration. Thus, the time interval marked by the shaded region corresponds to time when LAT covered the transient. |
| In the text | |
|
Fig. E.1. Lower limit on the bulk Lorentz factor as a function of the isotropic-equivalent energy released during all three episodes. The lower limits are determined using two methods: the afterglow deceleration time (squares) and γ–γ absorption (circles). The color bar indicates the corresponding luminosity distance to DBE. For comparison, we show total isotropic-equivalent energy measured for Swift J2058+05 (Cenko et al. 2012; Pasham et al. 2015) and Swift J1644+57 (Burrows et al. 2011) as dashed blue and red vertical lines. |
| In the text | |
|
Fig. G.1. Comparison of the intrinsic properties of DBE, computed for different redshifts, with the Amati relation (a) and the Yonetoku relation (b). The green line in each panel shows the corresponding relation, with the green-shaded area indicating its 3σ scatter. The colored lines display Ep, z as a function of Eiso (left) and Liso (right), computed for spectra D, B, and E (distinguished by line style) as a function of z, encoded by the color map. Circles on top of each curve denote reference redshift values, z = 0.1, 1, 2. The blue-shaded bands indicate the 1σ confidence intervals (for spectrum B in the left panel; for spectra D, B, and E in the right panel), while the blue dots denote regions corresponding to lower limits on the fitted Ep (for D, E, and D+B+E in the left panel). |
| In the text | |
Current usage metrics show cumulative count of Article Views (full-text article views including HTML views, PDF and ePub downloads, according to the available data) and Abstracts Views on Vision4Press platform.
Data correspond to usage on the plateform after 2015. The current usage metrics is available 48-96 hours after online publication and is updated daily on week days.
Initial download of the metrics may take a while.