Fig. 2.

Download original image
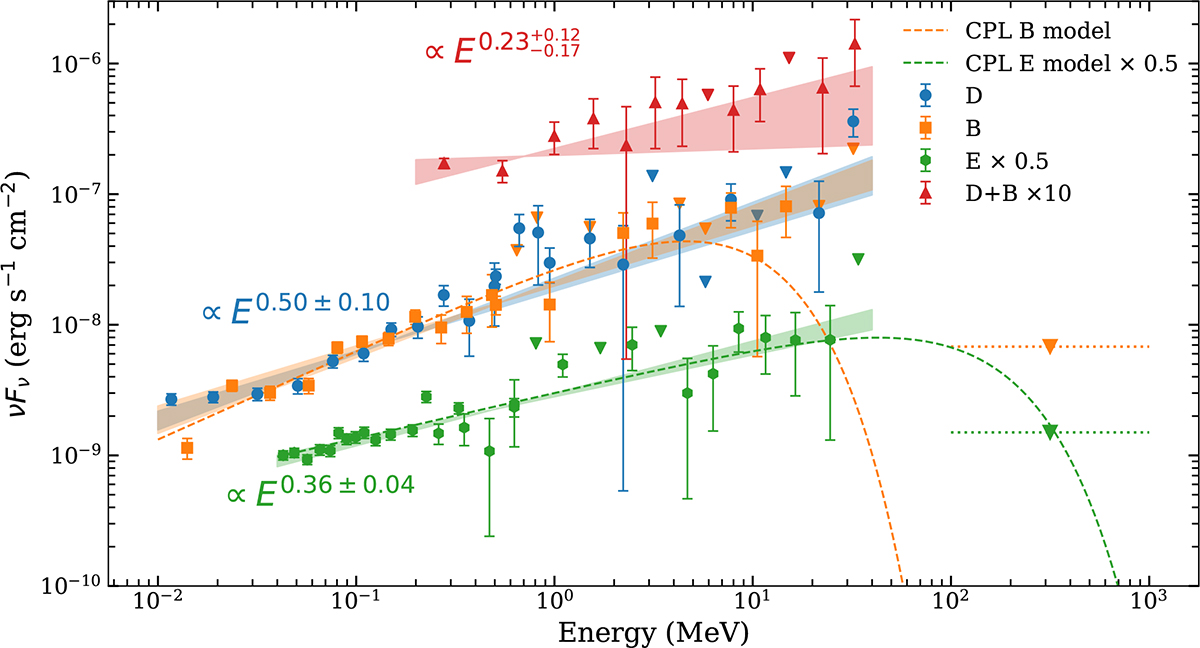
Spectral energy distributions of events D, B, and E. The derived data points for the time-integrated spectra of D, B, and E along with the best-fit power-law models (with 1σ uncertainties) are shown using the blue, orange, and green symbols and shaded regions, respectively. The dashed orange and green lines represent average cutoff power-law models for the time-integrated spectra of events B and E. Upper limits between 100 MeV and 1 GeV (3σ) are shown as inverted triangles. The combined D and B spectrum above 200 keV along with its best-fit model (1σ) are shown using red triangles and a red shaded region. The corresponding spectral slopes (2 − α) are also indicated.
Current usage metrics show cumulative count of Article Views (full-text article views including HTML views, PDF and ePub downloads, according to the available data) and Abstracts Views on Vision4Press platform.
Data correspond to usage on the plateform after 2015. The current usage metrics is available 48-96 hours after online publication and is updated daily on week days.
Initial download of the metrics may take a while.


