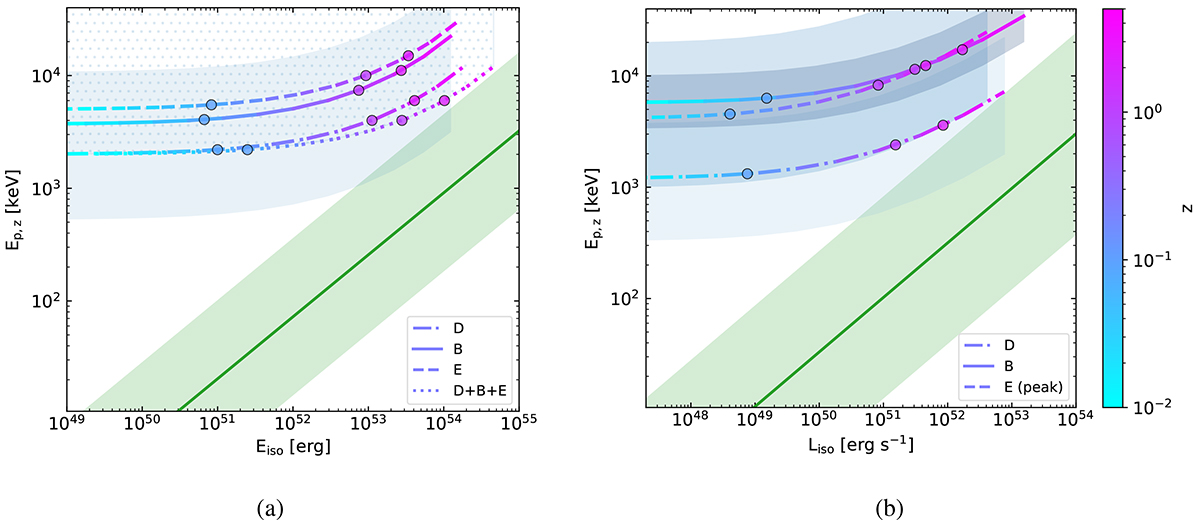
Fig. G.1.
Download original image
Comparison of the intrinsic properties of DBE, computed for different redshifts, with the Amati relation (a) and the Yonetoku relation (b). The green line in each panel shows the corresponding relation, with the green-shaded area indicating its 3σ scatter. The colored lines display Ep, z as a function of Eiso (left) and Liso (right), computed for spectra D, B, and E (distinguished by line style) as a function of z, encoded by the color map. Circles on top of each curve denote reference redshift values, z = 0.1, 1, 2. The blue-shaded bands indicate the 1σ confidence intervals (for spectrum B in the left panel; for spectra D, B, and E in the right panel), while the blue dots denote regions corresponding to lower limits on the fitted Ep (for D, E, and D+B+E in the left panel).
Current usage metrics show cumulative count of Article Views (full-text article views including HTML views, PDF and ePub downloads, according to the available data) and Abstracts Views on Vision4Press platform.
Data correspond to usage on the plateform after 2015. The current usage metrics is available 48-96 hours after online publication and is updated daily on week days.
Initial download of the metrics may take a while.