Fig. 5
Download original image
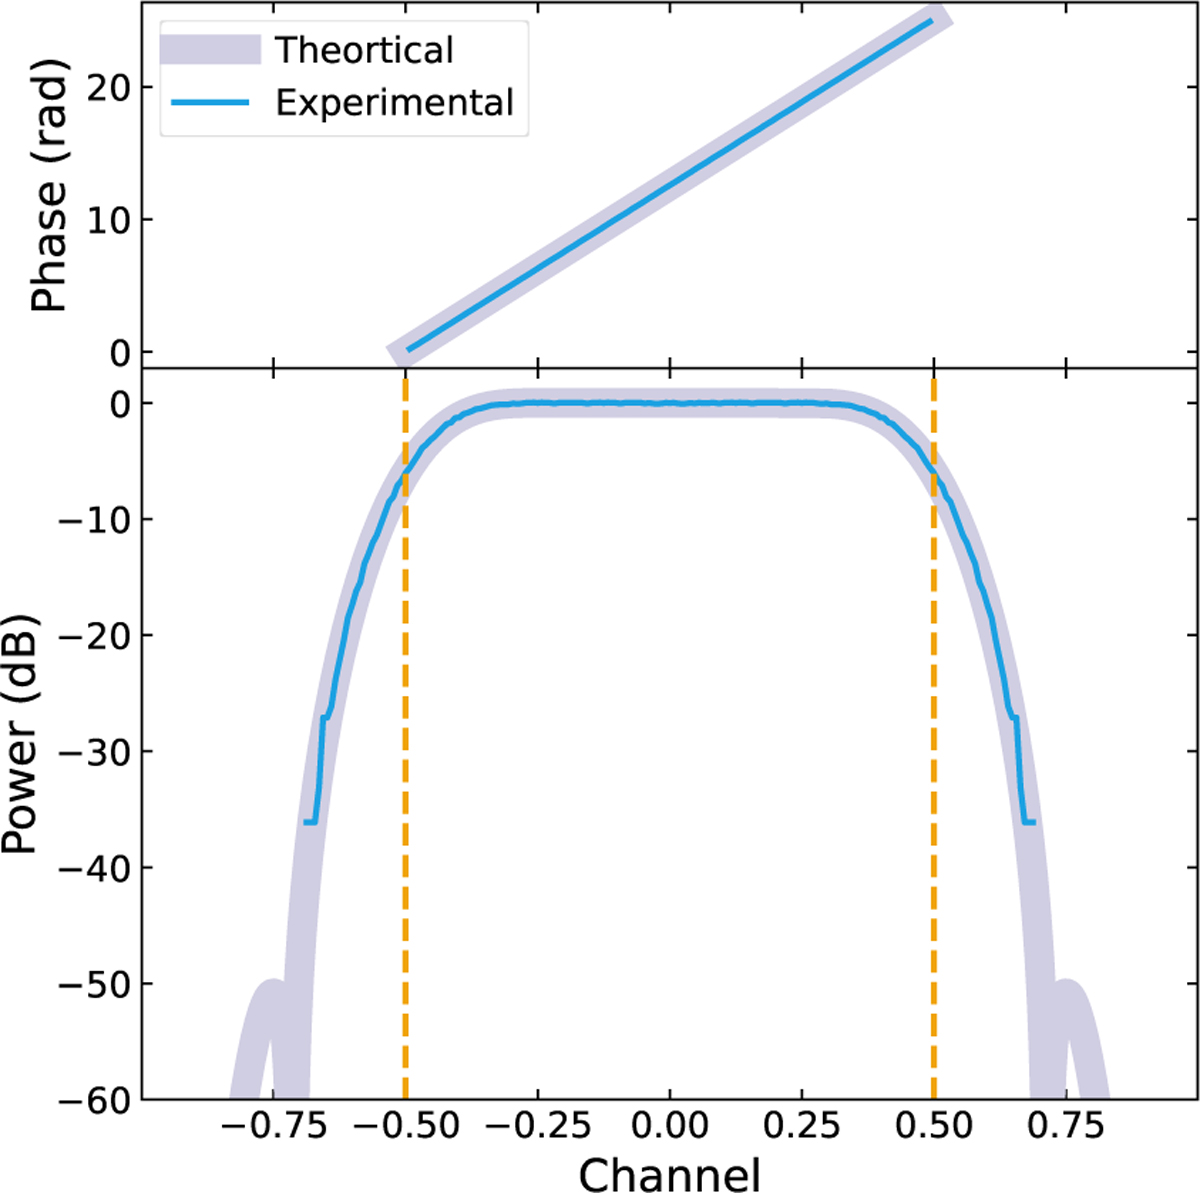
Measured channel frequency response of the critically sampled PFB. The upper panel shows the phase response and the bottom panel shows the amplitude response. The thin blue solid line represents the measured channel response, while the thick purple solid line represents the theoretical channel response. The yellow dashed lines represent the edges of one channel.
Current usage metrics show cumulative count of Article Views (full-text article views including HTML views, PDF and ePub downloads, according to the available data) and Abstracts Views on Vision4Press platform.
Data correspond to usage on the plateform after 2015. The current usage metrics is available 48-96 hours after online publication and is updated daily on week days.
Initial download of the metrics may take a while.