Open Access
Fig. 6
Download original image
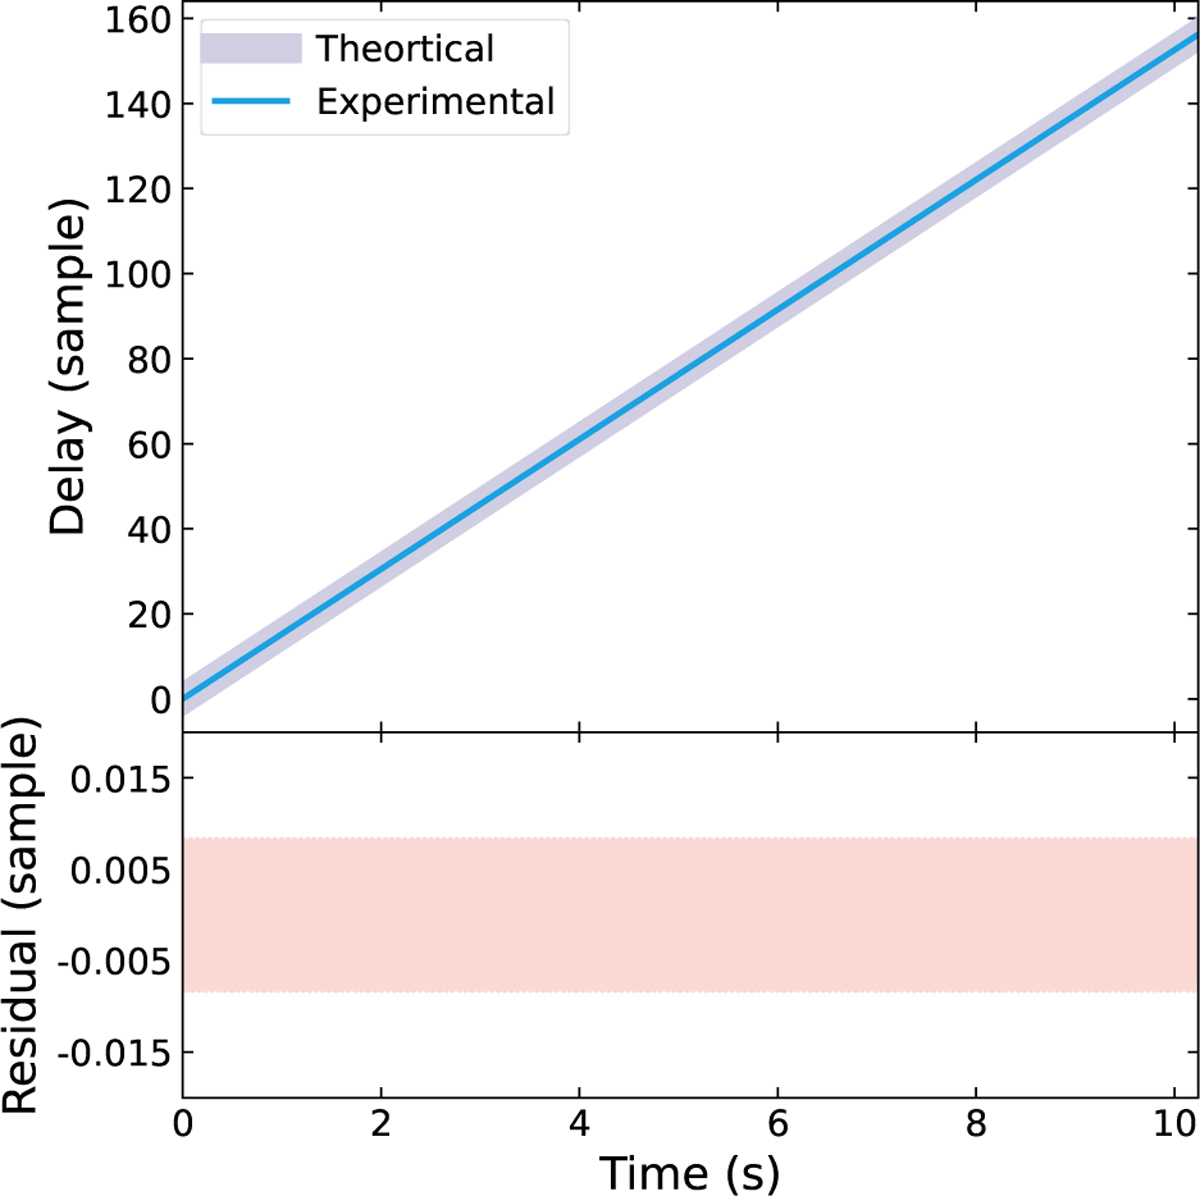
Measured delay based on the phase of the output data of the F-engine with a sine wave injection. The upper panel shows the measured delays (thin solid blue line) and injected delays (thick purple solid line). The bottom panel shows the delay residuals between measured delays and injected delays.
Current usage metrics show cumulative count of Article Views (full-text article views including HTML views, PDF and ePub downloads, according to the available data) and Abstracts Views on Vision4Press platform.
Data correspond to usage on the plateform after 2015. The current usage metrics is available 48-96 hours after online publication and is updated daily on week days.
Initial download of the metrics may take a while.