Open Access
Fig. 4
Download original image
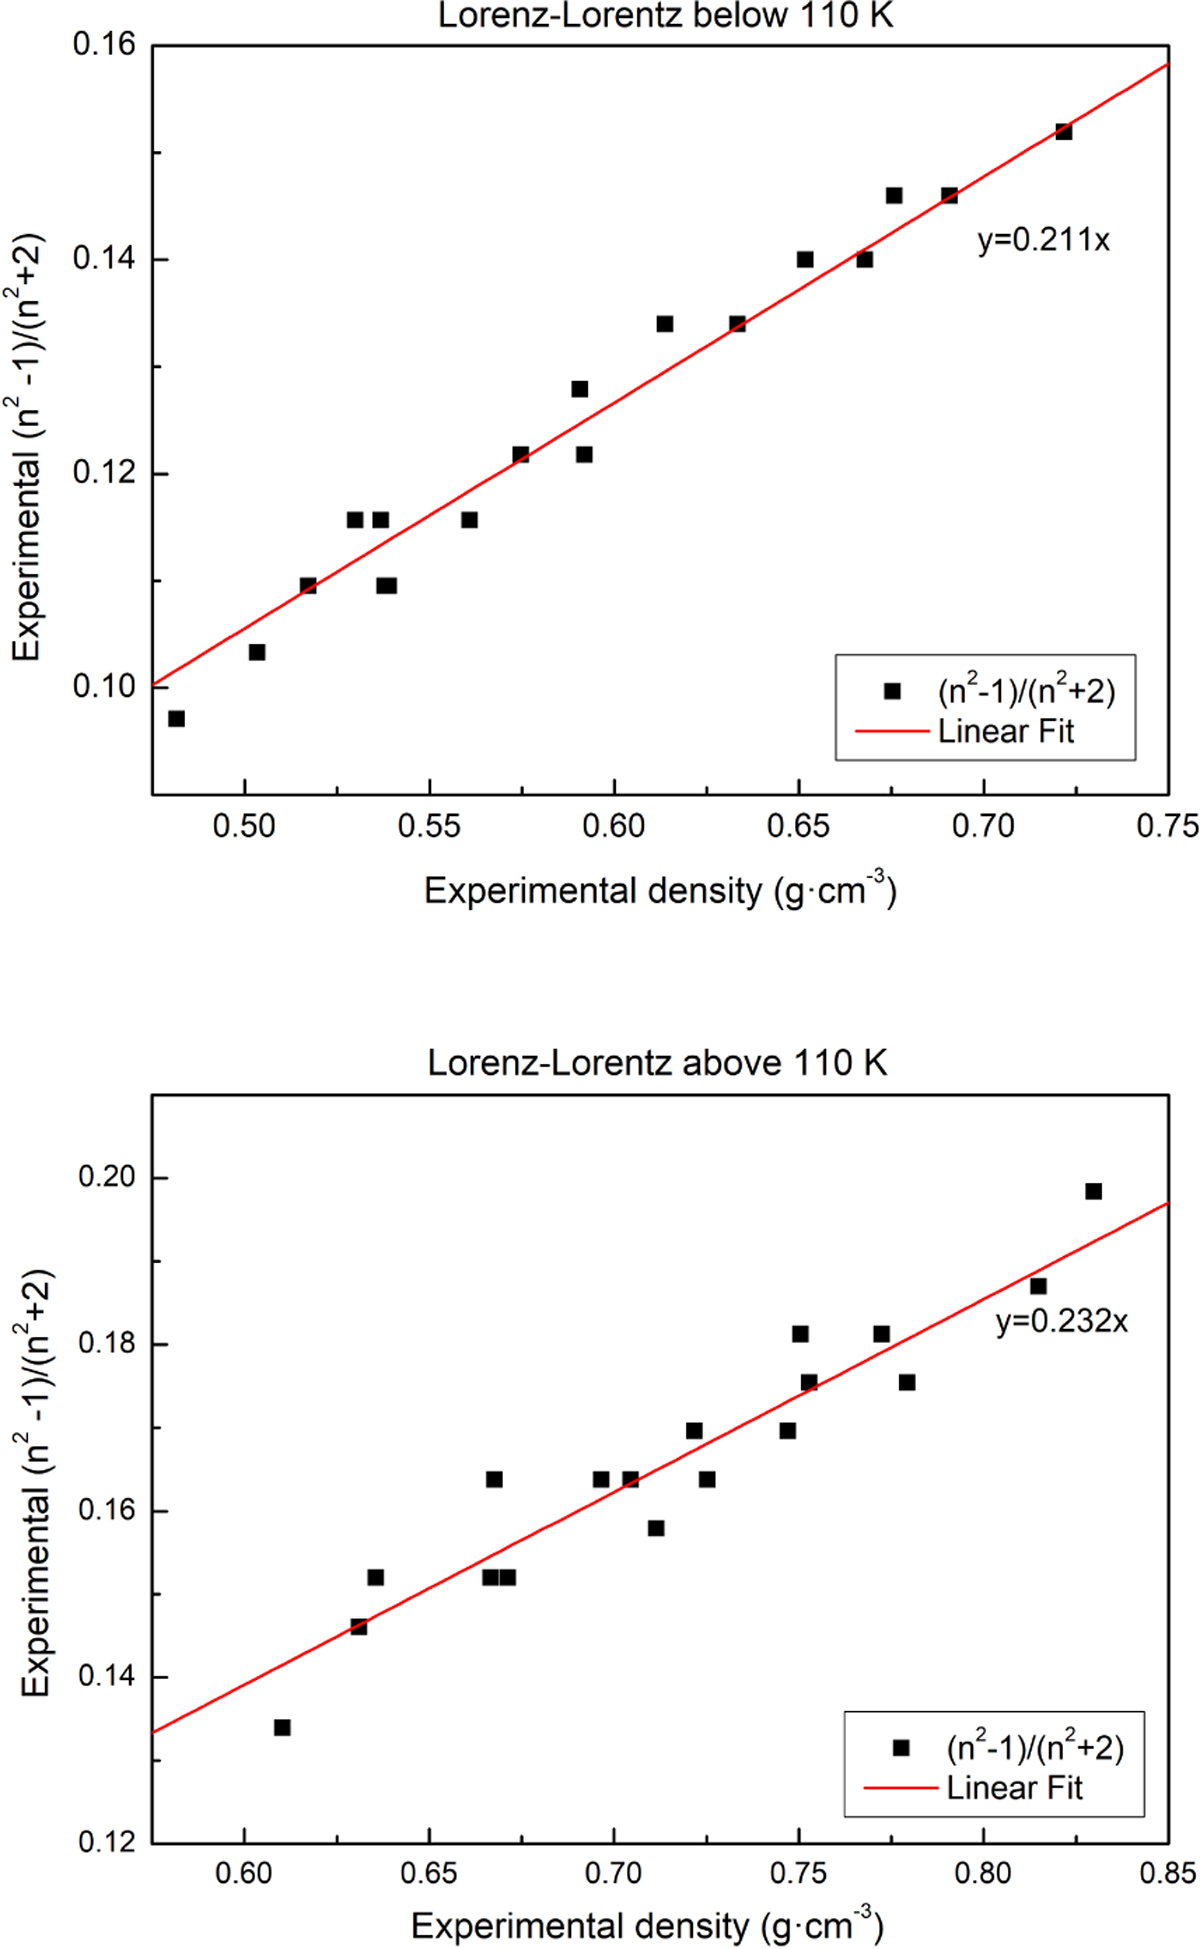
Experimental L factor obtained from our density and refractive index values with a deposition rate of −1 nm s-1 (3 Hz s-1). The top panel plots experiments from 33 K to 110 K, and the bottom panel from 115 K to 155 K.
Current usage metrics show cumulative count of Article Views (full-text article views including HTML views, PDF and ePub downloads, according to the available data) and Abstracts Views on Vision4Press platform.
Data correspond to usage on the plateform after 2015. The current usage metrics is available 48-96 hours after online publication and is updated daily on week days.
Initial download of the metrics may take a while.