| Issue |
A&A
Volume 703, November 2025
|
|
|---|---|---|
| Article Number | A89 | |
| Number of page(s) | 7 | |
| Section | Interstellar and circumstellar matter | |
| DOI | https://doi.org/10.1051/0004-6361/202556595 | |
| Published online | 06 November 2025 | |
Density and refractive index of interstellar water ice analogs at different deposition temperatures
1
Centro de Tecnologías Físicas, Universitat Politècnica de València, Plaza Ferrándiz-Carbonell, 03801 Alcoy, Spain
2
Centro de Astrobiología (CSIC-INTA), Ctra. de Ajalvir, km 4, Torrejón de Ardoz, 28850 Madrid, Spain
3
Faculty of Aerospace Engineering, Delft University of Technology, Delft, The Netherlands
4
Leiden Observatory, Leiden University, PO Box 9513, 2300 RA Leiden, The Netherlands
★ Corresponding author: This email address is being protected from spambots. You need JavaScript enabled to view it.
Received:
25
July
2025
Accepted:
17
September
2025
Abstract
Context. Water is the dominant component in interstellar ice mantles covering dust grains. Infrared observations of icy grains show evidence of structural variations in water ice.
Aims. This work presents the experimental study of the morphology and optical properties of interstellar water ice analogs formed under various conditions of deposition.
Methods. The real part of the refractive index (n) is obtained by double laser interferometry, and the average density (ρav) is measured with a quartz crystal microbalance. The experiments consisted of background-deposited water ice in a high-vacuum system, from 33 to 155 K, with a 532 nm laser.
Results. The experiments show two regimes for n and ρav below and above 110 K. Below 110 K, both n and ρav increase with the deposition temperature. This increase is not linear with temperature, but exhibits a few steps at distinct temperatures. At 115 K, n and ρav decrease, marking the start of crystallite formation. At higher temperatures, both values increase again up to 150 K. The final values at 155 K are lower than at 150 K, indicating that the crystalline structure begins to change from cubic to hexagonal.
Conclusions. We discuss the validity of the Lorenz-Lorentz equation for a polar molecule (water), depending on the ice structure, with hydrogen bonding influencing the polarizability. We find that a faster deposition produces lower values of n and ρav. This effect is less notable at lower temperatures. Our lowest deposition rate lets us compare results obtained in ultrahigh- and high-vacuum systems and extrapolate results to astrophysical conditions. The attenuation of the reflected light at different temperatures unveils a homogeneous structure for amorphous ices and non-compact crystalline ices. The high ice porosity derived from this work, 55% porosity at the lowest temperatures near 30 K, enhances grain growth and enables a more efficient trapping of chemical species, and consequently their reactions within the pores.
Key words: methods: laboratory: solid state / techniques: interferometric / ISM: structure
© The Authors 2025
 Open Access article, published by EDP Sciences, under the terms of the Creative Commons Attribution License (https://creativecommons.org/licenses/by/4.0), which permits unrestricted use, distribution, and reproduction in any medium, provided the original work is properly cited.
This article is published in open access under the Subscribe to Open model. This email address is being protected from spambots. You need JavaScript enabled to view it. to support open access publication.
1 Introduction
Water ice is the most abundant ice in the Universe. It drives cometary activity (e.g., Tamai et al. (2023); Bockelée-Morvan et al. (2004) and is the main component found on the surface of other Solar System objects such as icy moons (Europa, Callisto, and Enceladus; Clark et al. (2013). In the interstellar medium (ISM), energetic processing of water-dominated icy grains is expected to play a role in the chemistry of dense molecular clouds and protoplanetary disks (Boogert et al. 2015; Whittet et al. 2001). This ubiquity led water to be the most studied ice for astronomical or terrestrial applications. Despite this, water still hides many interesting behaviors that are not yet fully explained regarding its morphology, porosity (Dohnálek et al. 2003; Raut et al. 2007; Cazaux et al. 2015) and its optical properties (Bouilloud et al. 2015; He et al. 2022).
Water ice has been observed in the ISM with the James Webb Space Telescope (JWST) (McClure et al. 2023; Beuther et al. 2023) and with other facilities, such as the Very Large Telescope (Pontoppidan et al. 2004). These facilities provide infrared (IR) spectral data with unprecedented resolution. The IR spectra can provide the ice column density N (in molecules cm-2), if accurate band strengths A (in cm molecule-1) are available, by
 (1)
(1)
where ∫τdν (in cm 1) is the integrated area (on an absorbance scale). Band strengths can be measured using the relation
 (2)
(2)
where mw is the molecular weight of the molecule, t is the thickness of the ice, ρav is the average density, and NA is the Avo-gadro’s number. The band strengths calculated in this way rely on the precision of previously measured ρav, as well as n(λlaser), which is required for measuring the thickness of the ice using interferometry. This value is also necessary to obtain the optical constants n(λIR) for the whole IR spectrum (Baratta & Palumbo 1998; Luna et al. 2018).
Previous work on the density of water ice apparently produced contradictory results depending on the technique used (Brown et al. (1996); Westley et al. (1998); Dohnálek et al. (2003). These contradictions often arise from the use of two different types of density: intrinsic (ρi), which does not consider pores and defects, and average (ρav), which does account for them. The term “bulk density” appears in different papers to refer to these two types of densities. Finally, papers often compare characteristics of ices formed under different conditions and with different thermal histories, which are incompatible when dealing with water ice. The values of n and ρav depend on the growth conditions and thermal history of the ice. Our new results complement those available and describe the influence of the ice structure on the values of n and ρav.
The conditions during ice growth define the physical properties of the ice. Collimated, diffuse, or background-deposited films form ices with different ρav and n. Water ice in Sekar & Baragiola (1999) and Dohnálek et al. (2003) was deposited in the same way using similar ultrahigh-vacuum (UHV) setups, but their density values differ due to the procedure used to calculate this parameter.
The results also differ depending on the deposition rate, as shown by Berland et al. (1995). They found that the slower the deposition rate, the more compact the ices grow. The increase in density is not linear with the deposition rate; instead, it exhibits discontinuous steps along with ranges of constant density.
A review of different refractive indices and densities can be found in Table 1 of Bouilloud et al. (2015). Hama & Watanabe (2013) presented in Table 4 the main results distinguishing intrinsic and average density. The general trend is that the refractive index increases with the ice deposition temperature up to a plateau. Before the plateau, there are two regimes: a lower one below 80 K and a higher one above 80 K. The plateau is achieved at different temperatures depending on the author, from 120 K to 140 K (Berland et al. 1995; Brown et al. 1996; Sekar & Baragiola 1999; Dohnálek et al. 2003; He et al. 2022). Results from Brown et al. (1996) also include discontinuous steps that were observed by Cazaux et al. (2015) using Monte Carlo models.
To the best of our knowledge, no experimental values have been reported for the average density of water ice formed by background deposition at different temperatures. Authors commonly determine the refractive index experimentally and use the Lorenz-Lorentz formula (e.g. Born & Wolf 1980; Guenther 1990) to obtain the density at different deposition temperatures:
 (3)
(3)
where L is the Lorenz-Lorentz factor, ρav is the average density, and n is the real part of the refractive index at a certain wavelength. A value of L around 0.21 cm3 g-1 is commonly adopted. For example, Seiber et al. (1970) obtained 0.205 cm3 g-1 at 589 nm, while Kofman et al. (2019) obtained the molar refraction at different wavelengths, taking as a reference L = 0.2072 cm3 g-1 at 632.8 nm.
A possible cause of discrepancies in the density values obtained is that some authors take the L factor from the bibliography, while others take a reference density and, using their own refractive index measured at the same temperature as the reference density, obtain their own L factor, which is then applied to the whole temperature range. In Labello (2011), there is a comparison between the water ice density calculated with the Lorenz-Lorentz factor (Dohnálek et al. 2003) and the density experimentally obtained with a quartz crystal microbalance (Pugh 2003) for collimated molecular beams at different angles of deposition. The densities obtained with the quartz crystal microbalance (hereafter QCMB) were systematically lower.
Another problem is that the Lorenz-Lorentz factor typically does not apply to molecules with permanent dipoles such as water (e.g. Born & Wolf 1980; Guenther 1990), but to nonpolar molecules without a permanent dipole moment in the absence of an electric field. Then, it would be desirable to obtain the average density values experimentally without relying on the validity of the Lorenz-Lorentz formula for water ice.
The goals of our work are:
to obtain the refractive index and, for the first time, the average density of background deposited water at different temperatures;
to derive the L factor, from experimentally measured ρav and n;
to study the effect of different rates of deposition at certain temperatures;
to explore the relation between the structural characteristics of water to the reflectance loss. Ghormley & Hochanadel (1970) performed a similar study on water crystallization during ice warming.
We present the experimental details in Sect. 2, which is divided into the experimental setup and the procedure. Section 3 includes the results on the values of n and ρav, the Lorenz-Lorentz applicability, the effect of the deposition rate, and the relation of reflectance loss with the water structure. Section 4 compares our results with previous ones and discusses the applicability of our new findings. Section 5 explores some possible astrophysical implications. Lastly, the conclusions are provided in Sect. 6.
2 Experimental
2.1 Setup
The experimental system consists of a high-vacuum (HV) chamber, whose base pressure during the experiments is 10-7 mbar. A detailed description can be found, for example, in Domingo et al. (2021). Two turbomolecular pumps (baked with a scroll pump) give an initial vacuum pressure of about 10-6 mbar. The chamber contains a Leybold cold head with two expansion stages. The first stage cools a radiation shield (T = 45 K), which has five 2 cm2 holes arranged mutually perpendicular around the sample position, and the second stage cools a sample holder in thermal contact with a gold-plated, optically flat QCMB. A calibrated National Instruments diode in thermal contact with the QCMB surface measures the temperature of the ice film and feeds an Oxford Instruments temperature controller. The current configuration does not allow temperature control below 33 K. Two laser beams (532 nm) reflect on the surface of the QCMB at different angles of incidence (7° and 70°). A third beam acts as a reference, similar to that described in Romanescu et al. (2010). Three diodes collect all three polarized laser signals perpendicular to the plane of incidence.
The vapor or gas enters the chamber from a pre-chamber through a needle valve pointing toward the rear of the sample holder through one of the holes of the radiation shield. The distance from the needle valve to the radiation shield is about 2 cm. During background deposition when regulating the opening of the needle valve, the pressure remains constant in the range 5×10⁻⁷ to 1×10⁻⁵ mbar measured with a cold cathode gauge located at the bottom of the chamber. For all the experiments, the pre-chamber pressure is constant (23 mbar), regulating the flux from the degassed triple-distilled water reservoir. The ice grows at a constant rate on the surface of the QCMB, which is located at the center of the chamber and surrounded by the radiation shield. The molecules arrive at the surface of the QCMB after interacting with the radiation shield or the walls of the chamber.
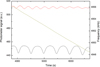 |
Fig. 1 Interference curves at 7° (red), 70° (black) incident angles, and QCMB frequency (kHz) vs. time (s) during deposition at constant rate. |
2.2 Procedure
When water vapor enters the chamber, recording of the laser interference curves begins. Moreover, the frequency of the QCMB decreases linearly with the deposited mass. Figure 1 shows the interference fringes of both lasers on the left axis, and the balance frequency on the right axis as a function of time. The red laser signal is incident at 7° and the black one at 70°. The deposition rate is considered constant, since a linear regression fit of the QCMB signal during deposition gives an error around the fifth significant figure.
The interference fringes allow the refractive index at 532 nm to be obtained from the quotient of their periods, as well as the thickness of the sample. The frequency variation at constant temperature measures the mass deposited per unit of surface. The ratio of both (mass per unit surface and thickness) provides the average density. The complete procedure is explained in detail in Domingo et al. (2015).
To determine the deposition rate in nm s-1, we divided the total thickness deposited by the growth time. The slope of the QCMB signal gives the deposition rate in Hz s-1, which measures the mass deposited per unit time through the Sauerbrey equation, ΔF = -S Δm, where ΔF is the frequency variation of the QCMB, S is the Sauerbrey constant, and Δm is the deposited mass (Domingo et al. 2021). Given that the surface is constant, the magnitude that relates both units, Hz and nm, is the density of the ice.
Figure 2 shows the interference patterns for three deposition temperatures. To study the reflectance loss of the samples, we measured the intensity difference between the laser’s first and fifth minima for the interference at 70° (black signal; see the interference pattern at the bottom of Fig. 2). This figure shows the reflectance loss differences at three deposition temperatures. At 100 K, the minima almost maintain constant laser signal intensities; however, at 40 K they diminish, and at 140 K the decrease is very clear. The reason for these differences and their relationship to the structure is discussed in Sect. 3.4. The graph also allows us to compare different densities for the same deposition time (~2200 s) and rate (3 Hz s-1 ); the more minima, the lighter the ice, because the deposited mass is the same (rate × time), but the ice films are thicker (corresponding to more minima).
The dispersion among experiments at the same temperature was used to estimate the error bars of 1% for the refractive index and 2% for the density. At 115 K and 150 K, we doubled the errors (2% and 4%, respectively) because the repeatability decreases at these two temperatures.
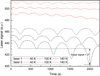 |
Fig. 2 Interference curves at incident angles of 7° (red) and 70° (black) vs. time (s) during deposition at a constant rate and temperatures of 40 K, 100 K, and 140 K. The graph shows the shifted interference curves. |
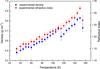 |
Fig. 3 Experimental refractive index (red circles, right y-axis) and average density obtained with the QCMB (blue squares, left y-axis) at different deposition temperatures (x-axis). |
3 Results
3.1 Experimental refractive index and density
Figure 3 represents the experimental n (red circles, right y-axis) and ραv (blue squares, left y-axis) at the same deposition rate (~1 nm s-1 or 3 Hz s-1 ) for fixed temperatures (Fig. 1). Both parameters increase with increasing deposition temperature, with a maximum at 150 K. Our results show three different regimes with increasing temperature, followed by both n and ραv : The first regime (33-80 K) shows the lowest slope and presents steps. These steps show two plateaus at 45 K and 75 K. The second regime (80-110 K) presents a slightly steeper slope with no steps. The third regime (above 115 K) starts with an abrupt decrease at 115 K followed by a steeper slope. The values of n and ραv split because the density decreases more than the refractive index at 115 K. Lastly, there is another decrease at 155 K. The cause of both decreases are discussed later (Sect. 4).
After deposition, the temperature was kept constant for several hours. The laser signals present no changes, indicating that variations are either nonexistent or below our detection limits.
This is in agreement with diffusion barriers that are high enough to inhibit changes at stable temperatures (Cazaux et al. 2015), both for surface diffusion (Nie et al. 2009) and bulk diffusion (Brown & George 1996).
Values of refractive index (n) and density (ρav) obtained using the QCMB technique at different deposition temperatures at the same rate of −1 nm s−1 (3 Hz s−1).
3.2 Lorenz-Lorentz factor
We obtained the L factor (Fig. 4) for two intervals below and above 110 K by fitting  versus ρav, from the experimental results shown in Fig. 3. The top panel presents the results up to 110 K, and the bottom panel presents the results from 115 K to 155 K. The respective slope for each linear fit is the L factor for that temperature range, with errors in the third significant figure. Temperatures below 110 K produce L = 0.211 ± 0.001 cm3 g-1, and for temperatures from 115 K to 155 K, we obtain L = 0.232 ± 0.002 cm3 g-1; the errors considered are the standard errors. If the experimental results are used in one single fit, the error increases and L = 0.223 cm3 g-1.
3.3 Deposition rate
All the experiments presented so far deposit at the same rate (~1 nm s-1). We also explore the effect of different deposition rates on the ρav and n values, and if they maintain the same corresponding L factor. The experiments at lower deposition rates are closer to the ices formed in the ISM rather than to planetary ices. Similar experiments have been performed recently in a UHV chamber (Escribano et al. 2025), exhibiting a similar variation of density on deposition rate as well as densities similar to those of our ices grown at rates slower than 1 nm s-1.
Figure 5 shows density values (see Table 2) obtained at different deposition rates. The density values decrease as the deposition rate increases for ices at 140 K, showing a plateau in the range 0.5-1.3 nm s-1 (3-5 Hz s-1). Deposits at 100 K follow a similar trend at low rates but maintain an almost constant density even at 2.3 nm s-1 (8 Hz s-1). At 40 K, the density does not vary for the deposition rates we explored. The observed variation is smaller at lower temperatures. The L factors obtained for these rate experiments are L = 0.21 cm3 g-1 at temperatures 100 K, 50 K, and 40 K, and L = 0.23 cm3 g-1 for ices deposited at 140 K.
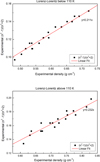 |
Fig. 4 Experimental L factor obtained from our density and refractive index values with a deposition rate of −1 nm s-1 (3 Hz s-1). The top panel plots experiments from 33 K to 110 K, and the bottom panel from 115 K to 155 K. |
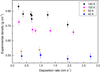 |
Fig. 5 Average density versus deposition rate at four deposition temperatures. |
Experimental values of density (ρav) as a function of the deposition rate (rd) at different deposition temperatures.
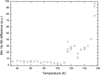 |
Fig. 6 Reflected laser signal loss due to water ice structure at different deposition temperatures. |
3.4 Reflectance signal losses
The interference patterns presented in Sect. 2.2 can also serve to interpret the observed differences below 110 K and above 115 K. The interference patterns show different behaviors because defects on the samples produce light scattering with variable intensities depending on the size of the inhomogeneities in the ice. Signal losses during deposition at different temperatures are represented in Fig. 6. The vertical axis shows the difference between the first and the fifth interference minima (Fig. 2). We use this difference because our deposits usually have five or six minima. This plot uses only the experiments with intermediate deposition rates ~1 nm s-1 (3 Hz s-1). The scattering is low and almost constant for amorphous ices below 110 K, with a minimum value between 90-110 K. This result is reproducible for all temperatures below 110 K. There is an abrupt increase in scattering at 115-125 K, and the deviation among repeated experiments exceeds the expected errors. Following the general behavior at 105 K, the scattering exhibits exponential growth up to 155 K, except in the 115-125 K interval and at 155 K.
4 Discussion
Our ραv and n results increase with deposition temperature. Previous studies (Berland et al. 1995; Brown et al. 1996; Dohnálek et al. 2003; Kofman et al. 2019; He et al. 2022) also reported increasing values with temperature, although they differ from one another. By contrast, Westley et al. (1998) obtained an almost constant value across all deposition temperatures. Most studies, including this research, get similar n values around 140 K (accounting for the wavelength used). The main differences appear at low temperatures, where we obtain lower experimental values. There are three possible causes: oriented or background deposits (Baragiola 2003; Dohnálek et al. 2003), the deposition rate (Berland et al. 1995), and the actual kinetic temperature of the vapor. The results in Fig. 3 have the same deposition rate, which is much slower than that reported by He et al. (2022), similar to that of Berland et al. (1995) and Brown et al. (1996), and faster than that of Dohnálek et al. (2003) and Kofman et al. (2019).
Concerning the density, as far as we know, there are no other direct measurements for background deposition than those presented here. The results obtained by Westley et al. (1998), also with a QCMB, correspond to ices deposited with a capillary array at short distances, with normal incidence and an order of magnitude or lower deposition rates. The results published by the other authors mentioned above used the L factor. Dohnálek et al. (2003) used a density reference value of 0.94 g cm-3, which was obtained by diffraction methods for amorphous solid water at 77 K (Narten et al. 1976). But this value implies no porosity, which is in disagreement with STM photographs (Thürmer & Bartelt 2008), as well as AFM and TEM photographs (Kouchi 2016). Brown et al. (1996) presented lower density values of about 0.88 g cm-3 above 110 K, because they took another density reference value at 90 K from Berland et al. (1994).
For crystalline ices, all the results agree (within errors) if the studies based on the L factor employed the appropriate density reference. Around 140 K, our results coincide within the margin of error with those presented by Westley et al. (1998). However, below 100 K, the average density values that we experimentally obtained are lower than those in all previous studies that used the same L factor. The variation in the deposition rate cannot justify these differences, according to the results presented in Fig. 5. Therefore, another factor must explain our lower density values. Clements et al. (2018) studied the effect of relaxation time using Monte Carlo simulations, which yielded densities below our experimental results for immediate relaxation of the depositing molecules. This result would imply that, if our average density values are lower than the rest, probably the energy of the molecules deposited in our experiments had, on average, a lower kinetic temperature than in other experimental setups. This is because the disposition of our radiation shield leads to a non-negligible amount of water molecules with kinetic temperatures below room temperature. These molecules are expected to stick in the solid phase with lower surface diffusion than the molecules at room temperature, leading to a more porous structure.
The ice structure affects the measured density as well as the scattering of light. Below 110 K, the reflectance losses are scarce and almost zero around 100 K (Fig. 6). This result reflects a structure formed by micropores, as noted by other authors and confirmed with other techniques (e.g., Mayer & Pletzer 1986; Westley et al. 1998; Baragiola 2003). However, above 115 K, the growth in reflectance losses shows that pore size or defects in the sample are increasing. This increase would be expected to grow exponentially if it were mainly due to scattering, as the size of the scatterers increases (Hansen & Travis 1974). There are two zones with “over-scattering,” which we associate with inhomogeneities in the ice, since at these temperatures phase transitions occur: from amorphous to cubic crystalline between 115-130 K in our experiments, and from cubic to hexagonal crystalline at 155 K. The coexistence of the two phases produces the larger defects, which in turn cause a measurable decrease in both the refractive index and the average density, thereby increasing porosity (see Figs. 3 and 7). The coexistence of amorphous and crystalline cubic phases can be seen in IR spectra with a shoulder at ~3380 cm-1 (Escribano et al. 2025). The coexistence of the two crystalline phases was studied in detail by Salzmann et al. (2024). Additionally, sizes and shapes can be seen in STM (Thürmer & Bartelt 2008), AFM, and TEM photographs (Kouchi 2016).
Berland et al. (1995) also studied the effect of different deposition rates. They found a decrease in density with increasing deposition pressure (faster rates). The variation depends on the temperature, following the same behavior pointed out before. They also reported deposition rates that remained constant at various pressures. Although a direct comparison is not possible, considering the interference curves shown in their Fig. 1, our results are consistent with their deposition pressure of ~3×10⁻⁶ Torr. Hence, we find a similar stability range for the density at lower temperatures. They did not report density variations at 140 K, probably because their reference density was too unrealistically high, as discussed before.
From our results, we expect that lower deposition rates lead to values converging to 0.90 g cm-3 when deposition occurs at 140 K or higher. The lower temperatures show almost constant densities for all the deposition rates.
Escribano et al. (2025) also studied the effect of the deposition rate on ices formed by depositing water vapor from a stainless steel tube positioned at 45° to the substrate normal at low deposition rates in UHV. Despite the difficulty of a direct comparison, they found similar trends. At higher temperatures, the faster the deposition, the lighter the ice. The observed variation is greater at higher temperatures. Our average density values coincide with their results at 100 K and 140 K for our lowest deposition rates (0.20 nm s-1 ). At 40 K and 50 K, our values are lower; this difference was to be expected because our deposition procedure leads to lighter ices at deposition temperatures below 100 K, as previously mentioned.
A possible difficulty when comparing ices grown with very high deposition rates is the effect of the enthalpy of deposition and the limited cooling power of the cryostat. Especially when studying thicker samples, the actual ice surface temperature is not trivial to measure due to their low thermal conductivity (Kouchi et al. 1992).
5 Astrophysical implications
We estimated the porosity of water ice using p = 1 − (ρav/ρi), where ρi is the intrinsic density of water ice, taken from diffraction experiments (Narten et al. 1976; Jenniskens 1995). Specifically, ρi = 1 ∙ 10 g cm-3 at 10 K, while ρi = 0.94 g cm-3 at 77 K (Narten et al. 1976). We assumed a linear decrease in ρi between 40 K and 65 K, since the transition from high- to low-density amorphous ice occurs in this range (Jenniskens 1995). In the range of 120-150 K, we used the values obtained by Kuhs et al. (1987), and 0.92 at 155 K (Röttger et al. 1994).
Our work demonstrates that water ice density and porosity are highly sensitive to several parameters during ice formation: surface temperature, deposition rate, and gas temperature. We show that at low temperatures and deposition rates around 1 nm s-1, a porosity exceeding 50% can be reached. In this case, our results are consistent with the presence of micropores (<20 A), which favor the capture of volatiles such as CO, N2, and CH4. This enables solid-state chemistry to occur above the sublimation temperatures of these species (e.g., Collings et al. 2004; Cazaux et al. 2015).
The resulting values of formation temperature, intrinsic and average densities, and porosity are presented in Table 3. Figure 7 shows the estimated porosity as a function of the formation temperature. Our results clearly show that ices deposited from gas at low temperatures are much more porous than previously estimated. Previous studies report a porosity of ~30% at 30 K (Bossa et al. 2015), while our results report a porosity of around 55% at this temperature. This low gas temperature used in our experiments is characteristic of astrophysical conditions, in which ices are deposited from cold gas in the molecular cloud phase. We show that the porosity of ices in such environments is much higher than previously assumed. This elevated porosity enables more efficient trapping of chemical species and may facilitate their reactions within the pores. Importantly, this porosity is preserved during the thermal evolution of the ice, as smaller pores tend to coalesce and merge into larger ones. Such high porosity could also have significant implications for grain coagulation -a critical step in planet formation, from dust grains to pebbles and eventually planetesimals (Armitage 2024). Although coagulation is stronger between icy grains than between bare grains, porous ices may enhance adhesion even more between icy grains, thus promoting more efficient growth during the early stages of planetary assembly.
6 Conclusions
Our results explain the behavior of water ice depending on surface temperature during background deposition, questioning or complementing previous results present in the bibliography:
Density and refractive index increase with the deposition temperature, from 33 K to 155 K. This trend breaks down locally at 115 K and 155 K, indicating phase transitions;
Below T ≤ 110 K the ice is amorphous; above T ≥ 115 K the ice presents crystallites or is fully crystalline;
Amorphous structure presents two regimes, below and above 80 K. The first regime presents steps with a minor slope;
We associate the density decrease at 115 K and 155 K with the presence of two phases. Amorphous and cubic crystallites at 115 K and a mixture of cubic and hexagonal crystals at 155 K;
Reflectance losses show that amorphous ice is homogeneous, with a minimum at 105 K. Above 115 K the losses increase exponentially, indicating a growth in crystallite size with temperature. It also reveals the presence of voids or defects among the crystals;
When two phases coexist (at 115 K and 155 K), the inhomogeneities in the ice produce an extra reflectance loss;
The deposition rate influences the refractive index and density. Generally speaking, the faster the deposit, the lighter the material is;
The effect of the deposition rate is especially noticeable at higher temperatures. At low temperatures, no decrease in density was appreciated within the explored range of deposition rates in our experiments;
The porosity values are about 50% at low deposition temperatures. It decreases from 55% at 33 K to 11% at 150 K;
The high ice porosity at the lowest temperatures, near 30 K, enhances grain growth and enables a more efficient trapping of chemical species and, consequently, their reactions within the pores.
Acknowledgements
This research has been funded by the projects PID2020-118974GB-C21, PID2020-118974GB-C22, PID2023-151513NB-C21, and PID2023-151513NB-C22 by the Spanish Ministry of Science and Innovation. B.E. acknowledges the support by grant PTA2020-018247-I from the Spanish Ministry of Science and Innovation/State Agency of Research MCIN/AEI.
References
- Armitage, P. J. 2024, arXiv e-prints [arXiv:2412.11064] [Google Scholar]
- Baragiola, R. A. 2003, Planet. Space Sci., 51, 953 [NASA ADS] [CrossRef] [Google Scholar]
- Baratta, G. A., & Palumbo, M. E. 1998, J. Opt. Soc. Am. A, 15, 3073 [Google Scholar]
- Berland, B. S., Haynes, D. R., Foster, K. L., et al. 1994, J. Phys. Chem., 98, 4358 [Google Scholar]
- Berland, B. S., Brown, D. E., Tolbert, M. A., & George, S. M. 1995, GRL, 22, 3493 [Google Scholar]
- Beuther, H., van Dishoeck, E. F., Tychoniec, L., et al. 2023, A&A, 673, A121 [NASA ADS] [CrossRef] [EDP Sciences] [Google Scholar]
- Bockelée-Morvan, D. C., Crovisier, J., Mumma, M. J., & Weaver, H. A. 2004, Comets II (University of Arizona Press) [Google Scholar]
- Boogert, A. A., Gerakines, P. A., & Whittet, D. C. 2015, Annu. Rev. Astron. Astrophys., 53, 541 [CrossRef] [Google Scholar]
- Born, M., & Wolf, E. 1980, Electromagnetic Theory of Propagation, Interference and Diffraction of Light, 6th edn. (Pergamon Press) [Google Scholar]
- Bossa, J.-B., Maté, B., Fransen, C., et al. 2015, ApJ, 814, 47 [NASA ADS] [CrossRef] [Google Scholar]
- Bouilloud, M., Fray, N., Bénilan, Y., et al. 2015, MNRAS, 451, 2145 [Google Scholar]
- Brown, D. E., & George, S. M. 1996, J. Phys. Chem, 100, 15460 [Google Scholar]
- Brown, D. E., George, S. M., Huang, C., et al. 1996, J. Phys. Chem, 100, 4988 [Google Scholar]
- Cazaux, S., Bossa, J.-B., Linnartz, H., & Tielens, A. G. G. M. 2015, A&A, 573, A16 [NASA ADS] [CrossRef] [EDP Sciences] [Google Scholar]
- Clark, R. N., Carlson, R., Grundy, W., & Noll, K. 2013, Observed Ices in the Solar System, eds. M. S. Gudipati & J. Castillo-Rogez (New York, NY: Springer New York), 3 [Google Scholar]
- Clements, A. R., Berk, B., Cooke, I. R., & Garrod, R. T. 2018, PCCP, 20, 5553 [Google Scholar]
- Collings, M. P., Anderson, M. A., Chen, R., et al. 2004, MNRAS, 354, 1133 [NASA ADS] [CrossRef] [Google Scholar]
- Dohnálek, Z., Kimmel, G. A., Ayotte, P., Smith, R. S., & kay, B. D. 2003, J. Chem. Phys., 118, 364 [CrossRef] [Google Scholar]
- Domingo, M., Luna, R., Satorre, M. A., Santonja, C., & Millán, C. 2015, Sensors, 5, 25123 [Google Scholar]
- Domingo, M., Luna, R., Satorre, M. A., Santonja, C., & Millán, C. 2021, ApJ, 906, 81 [NASA ADS] [CrossRef] [Google Scholar]
- Escribano, B., del Burgo Olivares, C., Carrascosa, H., et al. 2025, A&A, 699, A79 [NASA ADS] [CrossRef] [EDP Sciences] [Google Scholar]
- Ghormley, J. A., & Hochanadel, C. J. 1970, Science, 171, 62 [Google Scholar]
- Guenther, R. 1990, Modern Optics (New York: John Wiley and Sons) [Google Scholar]
- Hama, T., & Watanabe, N. 2013, Chem. Rev., 113, 8783 [Google Scholar]
- Hansen, J. E., & Travis, L. D. 1974, Space Sci. Rev., 16, 527 [Google Scholar]
- He, J., Diamant, S. J. M., Wang, S., et al. 2022, ApJ, 925, 179 [NASA ADS] [CrossRef] [Google Scholar]
- Jenniskens, Peter; Blake, D. F. 1995, Science, 265, 753 [Google Scholar]
- Kofman, V., He, J., Kate, I. L., & Linnartz, H. 2019, ApJ, 875, 131 [NASA ADS] [CrossRef] [Google Scholar]
- Kouchi, A. 2016, AILab Workshop, 1, 1 [Google Scholar]
- Kouchi, A., Greenberg, J. M., Yamamoto, T., & Mukai, T. 1992, ApJ, 388, L73 [Google Scholar]
- Kuhs, W., Bliss, D., & Finney, J. 1987, J. Phys. Colloques, 48, C1 [Google Scholar]
- Labello, J. M. 2011, PhD thesis, University of Tennessee, USA [Google Scholar]
- Luna, R., Molpeceres, G., Ortigoso, J., et al. 2018, A&A, 617, A116 [NASA ADS] [CrossRef] [EDP Sciences] [Google Scholar]
- Mayer, E., & Pletzer, R. 1986, Lett. Nat., 319, 298 [Google Scholar]
- McClure, M. K., Rocha, W., Pontoppidan, K., et al. 2023, Nat. Astron., 7, 431 [NASA ADS] [CrossRef] [Google Scholar]
- Narten, A., Venkatesh, C.-G., & Rice, S. 1976, J. Chem. Phys., 64, 1106 [NASA ADS] [CrossRef] [Google Scholar]
- Nie, S., Bartelt, N. C., & Thürmer, K. 2009, Phys. Rev. Lett., 102, 136101 [Google Scholar]
- Pontoppidan, K. S., van Dishoeck, E. F., & Dartois, E. 2004, A&A, 426, 925 [NASA ADS] [CrossRef] [EDP Sciences] [Google Scholar]
- Pugh, D. M. 2003, Master’s thesis, PhD University of Virginia, USA [Google Scholar]
- Raut, U., Famá, M., Teolis, B. D., & Baragiola, R. A. 2007, J. Chem. Phys., 127, 204713 [NASA ADS] [CrossRef] [Google Scholar]
- Romanescu, C., Marschall, J., Kim, D., Khatiwada, A., & Kalogerakis, K. S. 2010, Icarus, 205, 695 [CrossRef] [Google Scholar]
- Röttger, K., Endriss, A., Ihringer, J., Doyle, S., & Kuhs, W. 1994, Acta Crystallogr., Sect. B: Struct. Sci, 50, 644 [Google Scholar]
- Salzmann, C. G., Murray, B. J., Fox-Powell, M. G., et al. 2024, Icarus, 410, 115897 [Google Scholar]
- Seiber, B. A., Wood, A. M., Smith, A. M., et al. 1970, Science, 170, 652 [Google Scholar]
- Sekar, K., & Baragiola, R. A. 1999, in Radiolysis of the Solar System, 573, A16 [Google Scholar]
- Tamai, C., Maté, B., Cazaux, S., & Satorre, M. A. 2023, A&A, 675, A47 [Google Scholar]
- Thürmer, K., & Bartelt, N. C. 2008, Phys. Rev. B: Condens. Matter, 77, 195425 [Google Scholar]
- Westley, M. S., Baratta, G. A., & Baragiola, R. A. 1998, J. Chem. Phys., 108, 3321 [NASA ADS] [CrossRef] [Google Scholar]
- Whittet, D. C. B., Gerakines, P. A., & Hough, J. H. 2001, ApJ, 547, 872 [Google Scholar]
All Tables
Values of refractive index (n) and density (ρav) obtained using the QCMB technique at different deposition temperatures at the same rate of −1 nm s−1 (3 Hz s−1).
Experimental values of density (ρav) as a function of the deposition rate (rd) at different deposition temperatures.
All Figures
|
Fig. 1 Interference curves at 7° (red), 70° (black) incident angles, and QCMB frequency (kHz) vs. time (s) during deposition at constant rate. |
| In the text | |
|
Fig. 2 Interference curves at incident angles of 7° (red) and 70° (black) vs. time (s) during deposition at a constant rate and temperatures of 40 K, 100 K, and 140 K. The graph shows the shifted interference curves. |
| In the text | |
|
Fig. 3 Experimental refractive index (red circles, right y-axis) and average density obtained with the QCMB (blue squares, left y-axis) at different deposition temperatures (x-axis). |
| In the text | |
|
Fig. 4 Experimental L factor obtained from our density and refractive index values with a deposition rate of −1 nm s-1 (3 Hz s-1). The top panel plots experiments from 33 K to 110 K, and the bottom panel from 115 K to 155 K. |
| In the text | |
|
Fig. 5 Average density versus deposition rate at four deposition temperatures. |
| In the text | |
|
Fig. 6 Reflected laser signal loss due to water ice structure at different deposition temperatures. |
| In the text | |
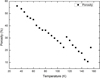 |
Fig. 7 Porosity estimation (Table 3) at different deposition temperatures. |
| In the text | |
Current usage metrics show cumulative count of Article Views (full-text article views including HTML views, PDF and ePub downloads, according to the available data) and Abstracts Views on Vision4Press platform.
Data correspond to usage on the plateform after 2015. The current usage metrics is available 48-96 hours after online publication and is updated daily on week days.
Initial download of the metrics may take a while.