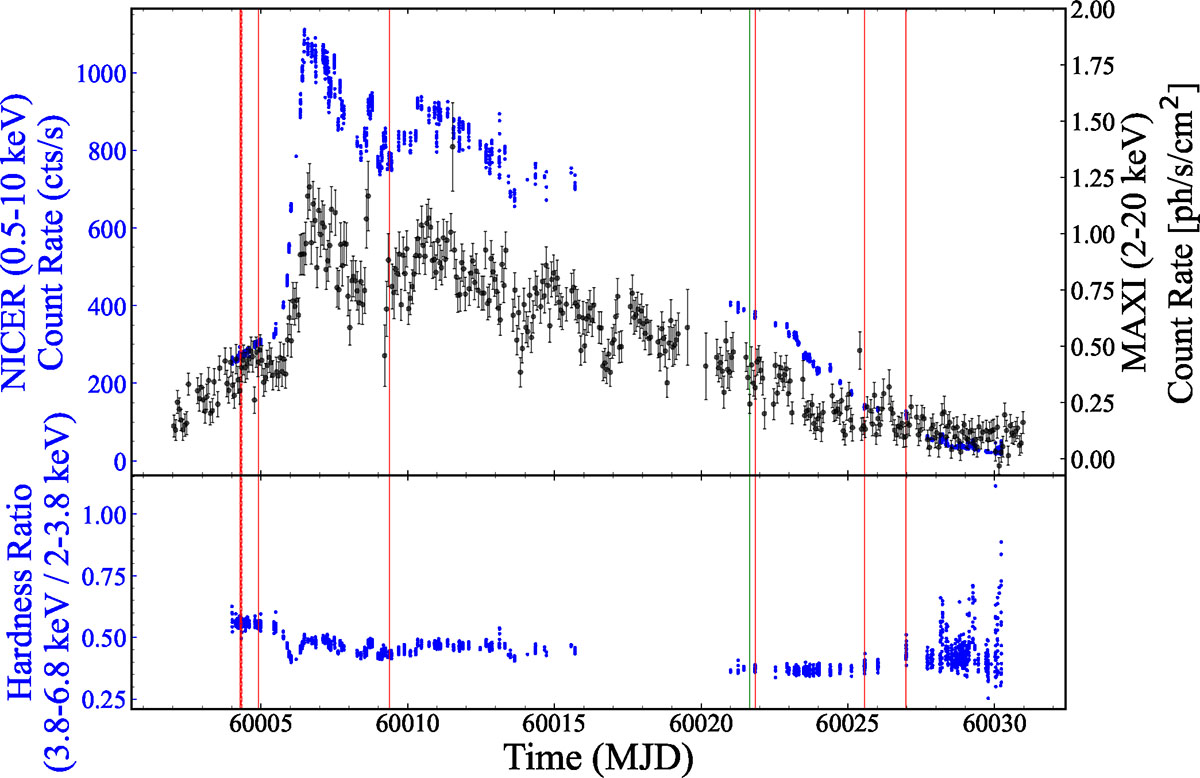
Fig. 1.
Download original image
The 2023 outburst light curves and hardness ratio of Terzan 5 X–3. The 2023 outburst began on MJD 60002 (2023 February 27). Upper panel: Light curves from NICER observations (0.5−10 keV, blue points) and MAXI (2−20 keV, black points). Lower panel: Hardness ratio, defined as the count rate ratio between 3.8−6.8 keV and 2.0−3.8 keV. Each data point represents 64 seconds of NICER data, with all bursts excluded. The dashed red lines indicate the type I X-ray bursts observed by NICER, and the dashed green line those observed by Chandra (Heinke et al. 2023).
Current usage metrics show cumulative count of Article Views (full-text article views including HTML views, PDF and ePub downloads, according to the available data) and Abstracts Views on Vision4Press platform.
Data correspond to usage on the plateform after 2015. The current usage metrics is available 48-96 hours after online publication and is updated daily on week days.
Initial download of the metrics may take a while.