| Issue |
A&A
Volume 703, November 2025
|
|
|---|---|---|
| Article Number | A254 | |
| Number of page(s) | 9 | |
| Section | Astrophysical processes | |
| DOI | https://doi.org/10.1051/0004-6361/202556639 | |
| Published online | 21 November 2025 | |
A transition from mixed-fuel to pure-helium thermonuclear bursts in Terzan 5 X–3/Swift J174805.3–244637
1
Key Laboratory of Stars and Interstellar Medium, Xiangtan University, Xiangtan, 411105 Hunan, PR China
2
Key Laboratory of Particle Astrophysics, Institute of High Energy Physics, Chinese Academy of Sciences, 19B Yuquan Road, Beijing 100049, China
⋆ Corresponding authors: This email address is being protected from spambots. You need JavaScript enabled to view it.
, This email address is being protected from spambots. You need JavaScript enabled to view it.
Received:
29
July
2025
Accepted:
17
October
2025
Abstract
We present a detailed analysis of seven thermonuclear X-ray bursts from Terzan 5 X–3/Swift J174805.3–244637 detected by NICER during the source’s 2023 outburst. Our analysis reveals a clear evolution of burst properties, identifying four non-photospheric radius expansion (non-PRE) bursts, one PRE candidate occurring in a mixed hydrogen–helium environment, and two powerful PRE bursts from pure helium ignition. The time-resolved burst spectra are described well by a model that includes a variable persistent emission component, quantified by a factor fa, due to the Poynting-Robertson drag. The strength of this interaction scales with burst luminosity: it is low in the faintest bursts (fa ≈ 1), becomes modest for the more luminous non-PRE burst and the PRE candidate (fa ≈ 1.5 − 2), and is very strong during the pure-helium PRE bursts (fa ≈ 6 − 8). This observed transition from mixed-fuel to pure-helium burning as the local mass accretion rate drops below ∼10% of the Eddington limit, ṁEdd, aligns with theoretical predictions. We verified this scenario with two independent methods. First, at the known distance to Terzan 5, the touchdown luminosities of both the pure helium PRE bursts and the mixed-fuel PRE candidate are consistent with reaching their respective, composition-dependent Eddington limits on the same plausible, massive neutron star of ∼2 M⊙. Second, the observed recurrence times of the non-PRE bursts were consistent with predictions for mixed-fuel burning.
Key words: binaries: general / stars: neutron / X-rays: binaries / X-rays: bursts
© The Authors 2025
 Open Access article, published by EDP Sciences, under the terms of the Creative Commons Attribution License (https://creativecommons.org/licenses/by/4.0), which permits unrestricted use, distribution, and reproduction in any medium, provided the original work is properly cited.
This article is published in open access under the Subscribe to Open model. This email address is being protected from spambots. You need JavaScript enabled to view it. to support open access publication.
1. Introduction
In low-mass X-ray binaries (LMXBs), matter from a low-mass companion star transfers onto a compact object via disk accretion (Frank et al. 1992). In systems with a neutron star (NS), the accumulation of accreted material on the stellar surface can lead to unstable thermonuclear burning, observed as type I X-ray bursts (see, e.g., Lewin et al. 1993; Strohmayer & Bildsten 2006; Galloway & Keek 2021, for reviews). For hydrogen-rich accretion, the burst properties are critically dependent on the fuel composition, which is primarily governed by the local mass accretion rate, ṁ (in Eddington units, ṁEdd). At very low rates (ṁ ≲ 0.01ṁEdd), stable hydrogen burning is inefficient. At moderate rates (0.01 ≲ṁ ≲ 0.1 ṁEdd), hydrogen burns stably into helium, forming a helium layer that later ignites pure helium burning via the 3α process. At higher rates (0.1 ≲ṁ ≲ 1 ṁEdd), ignition occurs before hydrogen is depleted, resulting in bursts from a mixed-fuel environment. Finally, at near-Eddington rates, burning can become (marginally) stable and the burst activities are quenched (Fujimoto et al. 1981; Strohmayer & Bildsten 2006; Li et al. 2021).
The time-resolved spectra of a type I X-ray burst are described well by a blackbody model. However, significant deviations from a simple blackbody often occur. More complex models are frequently required to account for continuum variations, such as disk reflection or a temporary enhancement of the persistent emission due to the Poynting-Robertson drag (Walker 1992; Worpel et al. 2013; Degenaar et al. 2018; Zhao et al. 2022; Lu et al. 2023; Yu et al. 2024, 2025). Furthermore, spectral features have been observed, including absorption and emission lines, as well as absorption edges (Li et al. 2018a; Strohmayer et al. 2019; Lu et al. 2024; Peng et al. 2025; Yu et al. 2025). In some X-ray bursts where the peak luminosity reaches the Eddington luminosity, the radiation pressure on the accreted material at the NS surface exceeds the gravitational potential, driving photospheric radius expansion (PRE; Lewin et al. 1993). These bursts were used as standard candles for distance determination (Kuulkers et al. 2003), and analysis of their touchdown moment and subsequent cooling tail provides a method for constraining the NS masses and radii (e.g., Sztajno et al. 1987; Özel et al. 2009; Suleimanov et al. 2017; Poutanen et al. 2014; Li et al. 2018a).
Terzan 5 is a dense and massive globular cluster located near the Galactic center, with a precisely measured distance of 6.62 ± 0.15 kpc (Martsen et al. 2022). The cluster is rich in X-ray sources, including a large population of quiescent NS LMXBs (Heinke et al. 2006; Degenaar et al. 2015) and two other well-known transients, EXO 1745–248 and the accreting millisecond pulsar IGR J17480–2446 (Strohmayer & Markwardt 2002; Miller et al. 2011). The target of this work, Terzan 5 X–3 (also known as Swift J174805.3–244637), was discovered as a new transient during an outburst in July 2012. Follow-up observations with Chandra confirmed it as the third known transient NS LMXB in the cluster (Wijnands et al. 2012; Heinke et al. 2012; Altamirano et al. 2012). During that outburst, a single type I X-ray burst with a long decay timescale (τ ≈ 16 − 29 s) was detected, which established that the system hosts a hydrogen-rich companion star (Bahramian et al. 2014). A new outburst from the source was detected by the Monitor of All-sky X-ray Image (MAXI)/Gas Slit Camera (GSC) on 2023 February 27, with its association with Terzan 5 X–3 quickly confirmed by Swift/X-Ray Telescope (XRT) and Chandra (Negoro et al. 2023; Kennea et al. 2023; Heinke et al. 2023). Throughout this most recent outburst, multiple type I X-ray bursts were observed by both Neutron star Interior Composition Explorer (NICER) and Chandra (Sanna et al. 2023; Heinke et al. 2023).
In this paper we present a detailed analysis of seven X-ray bursts from Terzan 5 X–3 observed by NICER during its 2023 outburst. The observations and outburst properties are described in Sect. 2. Our analysis of the persistent and time-resolved burst spectra is detailed in Sect. 3. We discuss the implications for the burst fuel composition in Sect. 4 and provide a summary of our findings in Sect. 5.
2. Observations
The 2023 outburst from Terzan 5 X–3 was first detected by MAXI on MJD 60002, and NICER carried out observations starting on MJD 60004. We analyzed the NICER data for this source, which include Obs. IDs 6203670101–6203670124, i.e., 24 observations with a total unfiltered exposure time of 131.5 ks.
We note that NICER is a non-imaging instrument with a relatively large field of view of (30′)2, which encompasses Terzan 5. This region is known to host numerous other X-ray sources, including several NS LMXBs. However, based on the X-ray monitoring of the cluster by MAXI, all other known transients were in a quiescent state during the 2023 outburst (Negoro et al. 2023; Kennea et al. 2023; Heinke et al. 2023). We can therefore confidently attribute the observed flux and bursting activity to Terzan 5 X–3, and any contribution from contaminating sources is considered negligible.
We processed NICER data using HEASOFT v6.34 and the NICER Data Analysis Software (NICERDAS). We first extracted the 1-second-binned light curves from calibrated unfiltered (UFA) event files to avoid missing type I X-ray bursts (see, e.g., Lu et al. 2023; Yu et al. 2024). Seven type I X-ray bursts were identified based on the shape of their light curves. Then, we used the nicer-l2 tool to extract cleaned event files by applying the standard filtering criteria. The 1-second-binned light curves in 0.5−10 keV were also extracted from the cleaned files using nicerl3-lc. A comparison of the UFA and cleaned data confirmed the necessity of our initial approach; for example, the rising phase of burst #2 and the later decay phase of burst #4 were present in the UFA data but absent from the standard cleaned event files. We also extracted light curves with 64 s time bins in three energy bands, 0.5−10 keV, 2.0−3.8 keV, and 3.8−6.8 keV, using the nicerl3-lc command and calculated the hardness ratio between the 2.0−3.8 keV and 3.8−6.8 keV bands.
2.1. The 2023 outburst profile
In Fig. 1 we present the light curve and hardness ratio evolution with 64 s time bins during the 2023 outburst. In addition, we also downloaded the MAXI data from the official web page1. The 2−20 keV outburst light curves are binned with one orbit. Type I X-ray bursts from NICER were excluded from the light curve. The onset times of the burst detected by NICER and Chandra are also marked (Heinke et al. 2023).
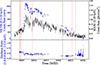 |
Fig. 1. The 2023 outburst light curves and hardness ratio of Terzan 5 X–3. The 2023 outburst began on MJD 60002 (2023 February 27). Upper panel: Light curves from NICER observations (0.5−10 keV, blue points) and MAXI (2−20 keV, black points). Lower panel: Hardness ratio, defined as the count rate ratio between 3.8−6.8 keV and 2.0−3.8 keV. Each data point represents 64 seconds of NICER data, with all bursts excluded. The dashed red lines indicate the type I X-ray bursts observed by NICER, and the dashed green line those observed by Chandra (Heinke et al. 2023). |
The light curves from NICER and MAXI are broadly consistent, with no evidence of dipping or eclipsing activity. The overall outburst profile, best traced by the continuous monitoring from MAXI, exhibits a multistage evolution. The outburst began with a slow-rise phase that lasted from approximately MJD 60001 to 60004, during which the source brightened steadily and was in a hard spectral state. This was followed by a fast-rise phase of ∼1.5 days, during which the count rate increased rapidly. The outburst peaked around MJD 60006. The subsequent decay phase, spanning ∼24 days, can be characterized as a gradual decline with fluctuations. This complex decay behavior is also visible in the NICER observations. Finally, the count rate declined toward its quiescent level.
The hardness-intensity diagram (HID) of the 2023 outburst reveals the characteristic clockwise “q”-shaped pattern typical of transient LMXBs (see Fig. 2). The outburst began in a spectrally hard state (hardness ratio ≳0.6), moving downward and to the right in the HID as it brightened. At a peak intensity of over 1000 cts/s, the source transitioned to a soft state, marked by a rapid drop in hardness to a ratio of ∼0.4. It remained in this soft state for the majority of the outburst decay as the intensity decreased. Finally, at a low intensity, the source transitioned back to the hard state. The first three bursts were triggered during the hard state, while the subsequent four occurred during the soft state. We note that no bursts were detected at the highest source intensities, above ∼800 cts/s. This absence could be due to observational gaps in the data coverage, or it could indicate that at the highest accretion rates, the thermonuclear burning on the NS surface became stable, thus suppressing the production of type I X-ray bursts (see, e.g., Yu et al. 2024 for the case of 4U 1820–30).
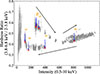 |
Fig. 2. HID of Terzan 5 X–3 during the 2023 outburst from NICER observations. All bursts are removed, and each point represents a segment of 64 s. The HIDs of the persistent emission before each NICER X-ray burst are marked as red diamonds. The black arrow indicates the direction of the HID evolution. |
2.2. The X-ray burst light curves
To analyze the temporal properties of the seven bursts, we extracted their light curves with 0.5 s time bins in the 0.5−10 keV range. For each burst, the underlying persistent emission was estimated from a 100-second pre-burst interval and subtracted to obtain the net burst light curve. The one exception was burst #2, which was identified in the UFA file and lacked pre-burst data; for this event, a 100-second post-burst interval was used for the background estimate. We defined the burst onset and end times as the epochs when the net count rate rose above and returned to 1.5 times the pre-burst average level, respectively. The rise time, Δtrise, was measured as the duration from onset to the time bin that first reached 90% of the peak count rate.
The resulting net light curves, presented in Fig. 3, reveal a clear evolution in the burst properties over the course of the outburst. The first three bursts are morphologically similar, with relatively low peak count rates of < 1600 counts s−1. The subsequent two bursts (bursts #4 and #5) reach higher peak rates of ∼1800 counts s−1. The final two bursts are distinct, exhibiting prominent double-peaked structures and significantly higher net count rates, peaking at ∼3000 counts s−1. A complete summary of these properties, along with the burst detected by Chandra during this outburst (Heinke et al. 2023), is provided in Table 1.
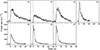 |
Fig. 3. Light curves of the seven X-ray bursts from Terzan 5 X–3 observed with NICER. Black lines are light curves in 0.5−10 keV with time bins of 0.5 s. The vertical dotted line marks the onset time of each burst. The dashed-dotted gray line represents the persistent emission, which was subtracted from the bursts. |
Burst parameter overview.
We searched for coherent burst oscillations in the 0.5−10, 0.5−3, and 3−6 keV event data for all seven bursts. Following standard techniques (e.g., Bilous & Watts 2019; Li et al. 2022), we computed Leahy-normalized power spectra in the 50−2000 Hz range using a 4-second sliding window fast Fourier transfer. No significant signal was detected. To place an upper limit on the oscillation amplitude, we calculated the fractional root-mean-square (rms) amplitude, Arms. Given the high count rates of the bursts, the contribution from the non-source background is negligible and the formula simplifies to  , where Nph is the total number of source photons in the interval and Ps is the signal power (Mahmoodifar et al. 2019; Remillard et al. 2022). The signal power was estimated from the measured power in the fast Fourier transfer, following the statistical methods of Groth (1975) and Vaughan et al. (1994, see also Bult et al. 2019). These methods are essential for correctly interpreting the power spectrum of photon counting data. Specifically, Groth (1975) first rigorously established that for a Leahy-normalized power spectrum, the power values arising from a pure Poisson process follow a chi-squared (χ2) distribution with two degrees of freedom (d.o.f.). Groth (1975) and Vaughan et al. (1994) provided a practical prescription for estimating the underlying signal power, Ps, and its statistical uncertainty from a measured power, Pm. From this analysis, we obtained an upper limit of 5.5% on the fractional rms amplitude of any coherent signal.
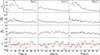 |
Fig. 4. Best-fitted parameters of the spectra from bursts #1−3 using the model TBabs × (bbodyrad + fa× (diskbb + bbodyrad)). From top to bottom: Bolometric blackbody flux (Fbb), blackbody temperature (kTbb), blackbody radius (Rbb), and the goodness of fit (χν2). In the bottom panel, the red and black lines indicate the χν2 with fa free and fixed at 1, respectively. Since allowing fa to vary did not improve the fit, it was fixed at 1. |
3. Spectral analysis
We performed the spectra analysis using Xspec v12.12.0 (Arnaud 1996). We generated the nibackgen3C50 background spectra (Remillard et al. 2021), the ancillary response files, and the response matrix files using the tool nicerl3-spec. Since NICER is a non-imaging instrument, the nibackgen3C50 model properly accounts for the non-X-ray particle background and the diffuse cosmic X-ray background, which contribute non-source counts. The errors of all parameters are quoted at the 1σ confidence level.
3.1. Pre-burst persistent emission
For each burst, we extracted a 100 s pre-burst persistent emission spectrum. However, for the second burst, due to missing pre-burst observations, we used a 100 s post-burst persistent spectrum instead. We performed optimal binning for each persistent spectrum using ftgrouppha as suggested by the NICER team. The 3C50 background spectrum for each pre-burst was subtracted. Subsequently, we fitted the persistent emissions with a model consisting of an accretion disk multi-blackbody, diskbb, plus a blackbody, bbodyrad, modified by the Tübingen-Boulder absorption model, TBabs. Thus, the model is TBabs × (diskbb + bbodyrad). The free parameters include the inner disk temperature, Tin, and normalization, Kdiskbb, for diskbb; the blackbody temperature, kTbb, and normalization, Kbb, for bbodyrad; and the equivalent hydrogen column density (NH) for TBabs. The absorption column densities were consistent across all spectra, NH ∼ 2.29 ± 0.03 × 1022 cm−2, which also agrees with the result reported by Bahramian et al. (2014). Therefore, in the subsequent analysis, we fixed NH to this value for all spectra during fitting.
The model fitted the per-burst spectra well with χ2 per d.o.f., χν2 ≈ 1. The unabsorbed bolometric fluxes in the 0.1−250 keV energy band were computed using the cflux tool. The best-fit parameters are listed in Table 2.
Best-fitted parameters of the pre-burst persistent spectra.
3.2. X-ray burst time-resolved spectroscopy
We extracted the time-resolved spectra of the X-ray bursts, employing variable exposure times ranging from 0.125 to 4 s to ensure a minimum of 1000 counts that include persistent emission for each spectrum. The burst spectra were grouped with a minimum of 20 counts per channel using the grappha tool. The hydrogen column density was fixed at 2.29 × 1022 cm−2 from the persistent spectral fitting (see Sect. 3.1). For each burst, the 3C50 background spectrum was subtracted.
We performed a time-resolved spectral analysis of all seven X-ray bursts. To account for both the burst emission and any potential enhancement of the accretion flow via the Poynting-Robertson drag, we fitted each time-resolved spectrum with the model TBabs × (bbodyrad + fa× (diskbb+bbodyrad)). Here, bbodyrad represents the burst emission. The component (diskbb + bbodyrad) accounts for the pre-burst persistent emission, with the parameters fixed to the best-fit values listed in Table 2. We assumed that only the amplitude of the persistent emission during the burst increases by a scaling factor, fa, modeled by constant in Xspec, and that the shape of persistent spectra did not change. We used an F-test to justify the inclusion of the enhancement factor, fa, as a free parameter in each time-resolved burst spectrum. The parameter was allowed to vary only if the F-test indicated a significant improvement (p < 0.003, corresponding to a significance level of > 3σ) over a model with fa fixed at 1. Otherwise, the simpler model with fa = 1 was adopted.
Most of burst spectra are described well by the fa model with χν2 ∼ 1 (see Figs. 4, 5, and 6). For the first two bursts, the fa parameter is consistent with unity throughout their evolution. This indicates that the persistent emission was not significantly enhanced during these bursts. For bursts #3, #4, and #5, we detected a modest and transient enhancement of the persistent flux. As shown in the fourth panels in Fig. 5, the fa factor was approximately 1.5 − 2 only around the peak of these bursts. For bursts #6 and #7, the enhancement factor, fa, was more significant, reaching 6 − 8 also around the burst peak.
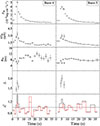 |
Fig. 5. Same as Fig. 4 but for bursts #4 (left) and #5 (right). In the fourth panels, we show the factor fa, which was set as a free parameter, improving the fit. The vertical dashed line indicates the touchdown moment for the PRE candidate, burst #4. |
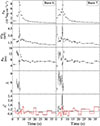 |
Fig. 6. Same as Fig. 4 but for bursts #6 (left) and #7 (right). The vertical dashed line indicates the touchdown moment. |
For bursts #1−3 and #5, the bolometric flux rose to a peak of approximately 1.6 − 3.9 × 10⁻⁸ erg cm−2 s−1 as the blackbody temperature reached a maximum of ∼2 − 3 keV. Subsequently, the bursts entered a cooling phase where the temperature steadily decreased over 20 − 30 s. Crucially, the apparent blackbody radius remained largely constant at a value of 4 − 6 km during the early phase; this suggested the absence of PRE, and they were thus classified as non-PRE bursts. For burst #4, the blackbody radius reached ∼8 km and then dropped to ∼5 km; meanwhile, the bolometric flux and the blackbody temperature peaked at 5.02 × 10⁻⁸ erg cm−2 s−1 and 3.25 keV, respectively. We consider #4 a PRE burst candidate even though the blackbody radius did not expand significantly.
The best-fitted parameters of last two bursts are very similar (see Fig. 6). The apparent blackbody radius, Rbb, underwent a rapid expansion in ∼1 s, increasing to over 13 km during the initial phase, while the temperature, kTbb, showed a corresponding drop. Then the radius decreased to ∼4 km and the temperature increased to a peak of ∼4 keV, indicating the NS photosphere was contracting. At this moment, the bolometric flux rose to a peak at ∼8 × 10⁻⁸ erg cm−2 s−1. Afterward, the photosphere was cooling and the bolometric flux decayed exponentially. These are signatures of PRE bursts.
Following the time-resolved spectral analysis, we derived several properties for each burst, which are presented in Table 1. The burst fluence, Eb, was calculated by numerically integrating the blackbody flux over the entire burst duration. We computed the decay timescale, τ, as the ratio of the burst fluence to the peak flux, τ = Eb/Fpeak. Finally, the observed recurrence time, ΔTobs, between consecutive bursts was calculated simply as the difference between their onset times.
4. Discussion
We analyzed the observations of Terzan 5 X–3 in the 2023 outburst, constructing light curves and HIDs based on the NICER and MAXI data. This outburst is remarkably similar to the 2012 outburst (Bahramian et al. 2014). We found seven type I X-ray bursts and performed a time-resolved burst spectral analysis. The persistent spectrum prior to each burst, in the energy range 1−10 keV, can be well fitted with a Tbabs × (diskbb + bbodyrad) model.
From the time-resolved spectral studies with the fa model, we found that the strength of the persistent emission enhancement, quantified by fa, scales directly with the burst luminosity. The two faintest non-PRE bursts showed no significant enhancement (fa ≈ 1); the two more luminous non-PRE bursts and one PRE candidate burst exhibited a modest and transient enhancement (fa ≈ 1.5 − 2); and the two most powerful PRE bursts underwent a strong enhancement (fa ≈ 6 − 8) during the burst peak. This clear trend provides compelling quantitative evidence of a physical scenario where the strength of the burst-disk interaction, likely caused by the Poynting-Robertson drag, is a direct function of the thermonuclear flash’s radiative power (Worpel et al. 2013, 2015).
We found systematic difference in the apparent blackbody radii, Rbb, during the cooling tails of these bursts (see Figs. 4, 5, and 6). Bursts #1−3 and #6−7 exhibited a consistent radius of approximately Rbb ≈ 6 km during the cooling tail. In contrast, bursts #4 and #5 showed a systematically larger radius during the cooling tail, Rbb ≈ 8 − 10 km. A plausible origin for this behavior is a change in the spectral color-correction factor, fc. The apparent blackbody radius, Rbb, is related to the true NS radius, RNS, by RNS = fc2Rbb, if the emission is from the whole NS surface. The color-correction factor accounts for the fact that the emergent spectrum from a NS atmosphere is not a perfect blackbody. Theoretical models show that fc depends on the atmospheric composition, temperature, burst flux, and surface gravity, and can also be affected by the accretion environment (e.g., Suleimanov et al. 2011, 2012; Poutanen et al. 2014). Bursts #4 and #5 occurred at a significantly higher persistent luminosity and in a spectrally softer state than the first three bursts (see Fig. 2). It is possible that the different accretion environments and higher surface temperature altered the atmospheric structure, leading to a different color-correction factor (i.e., a slightly smaller fc) for these bursts. This would manifest as a larger apparent radius, Rbb, as we observe.
4.1. Two burst types: Evidence from morphology
During its 2012 outburst, Terzan 5 X–3 exhibited a single non-PRE burst with a rise time of 3 s and a long decay of τ ≈ 16 − 29 s. This duration is a clear signature of a mixture of hydrogen and helium burning, which confirms that the binary hosts a NS accreting from a hydrogen-rich companion (Bahramian et al. 2014).
In the 2023 outburst, the properties of the seven X-ray bursts strongly suggest a change in the burning fuel. The first five bursts were non-PRE events with rise times of 2−3 s and decay timescales (τ = Eb/Fpeak) of 6−21 s (see Table 1). Such long durations are characteristic of mixed hydrogen–helium burning, where the energy release is moderated by β-limited CNO cycle reactions. In stark contrast, the final two bursts of the 2023 outburst were powerful PRE events. They exhibited short rise times of ∼1 s and rapid decays (τ ≈ 5 s). This impulsive morphology is the classic signature of unstable pure helium ignition via the 3α process, which proceeds on a much faster reaction timescale. Based on this strong morphological evidence, we suggest that the fuel for the bursts transitioned from mixed hydrogen–helium to pure He burning over the course of the outburst.
4.2. The PRE bursts: A standard candle test for fuel composition
Our fuel composition hypothesis can be tested using the PRE bursts. The bolometric flux at the touchdown moment of a PRE burst is expected to correspond to the Eddington luminosity (LEdd), making these events standard candles (Kuulkers et al. 2003). Since LEdd depends on the atmospheric hydrogen fraction, X, we can test our hypothesis by comparing the derived distance for different fuel compositions to the known distance of Terzan 5. The observed average touchdown flux of the two PRE bursts (#6–7) is FTD = (8.0 ± 0.3)×10−8 erg s−1 cm−2. At the precise distance measurement of 6.62 ± 0.15 kpc to Terzan 5 (Martsen et al. 2022), the luminosity at the touchdown is LTD = 4πD2FTD = (4.2 ± 0.3)×1038 erg s−1. We compared this value to the theoretical Eddington luminosity, which includes a temperature-dependent correction for the opacity of the scattering atmosphere (Lewin et al. 1993; Suleimanov et al. 2012; Poutanen 2017),
![Mathematical equation: $$ \begin{aligned} L_{\rm Edd,\,\infty }&=\frac{8\pi Gm_{p} M_{\rm NS}c[1+(kT/39.4\,\mathrm{keV})^{0.976}]}{\sigma _{\rm T}(1+X)(1+z)}\nonumber \\& = 2.7\times 10^{38}\left(\frac{M_{\rm NS}}{1.4\,M_\odot }\right) \frac{1+(kT/39.4\,\mathrm{keV})^{0.976}}{(1+X)}\nonumber \\&\qquad \times \left(\frac{1+z}{1.31}\right)^{-1}\,\mathrm{erg\,s^{-1}}, \end{aligned} $$](/articles/aa/full_html/2025/11/aa56639-25/aa56639-25-eq9.gif) (1)
(1)
where mp is the mass of the proton, σT is the Thompson scattering cross section, kT is the effective temperature of the atmosphere (in keV), G is the gravitational constant, the gravitational redshift factor 1 + z = (1 − 2GMNS/Rc2)−1/2, and X is the mass fraction of hydrogen. We assumed the blackbody temperature at the touchdown moment as the effective temperature, that is, kT = kTTD. For our observed touchdown temperature of kT ≈ 4.0 keV, this equation simplifies to LEdd, ∞ ≈ 3.0 × 1038 (MNS/1.4 M⊙)(1.31/1 + z)/(1 + X) erg s−1. To produce the observed luminosity would require a NS mass of MNS ≈ 3.3 M⊙ for X = 0.7 and MNS ≈ 2 M⊙ for X = 0, assuming the NS radius of 10−13 km (e.g., Dittmann et al. 2024; Vinciguerra et al. 2024). In the former case, the mass significantly exceeds the maximum known mass for a NS, allowing us to confidently reject this scenario (e.g., Kiziltan et al. 2013). For the PRE candidate, burst #4, its observed peak flux of FTD ≈ 5 × 10⁻⁸ erg s−1 cm−2 corresponds to an observed luminosity of LTD ≈ 2.76 × 1038 erg s−1. Producing this lower observed luminosity in mixed hydrogen–helium with X = 0.7 also requires a NS mass of MNS ≈ 2 M⊙, consistent with the PRE bursts in a pure He environment. Therefore, our analysis strongly indicates that the observed PRE events reflect a transition from a mixed-fuel PRE burst to more powerful pure-helium PRE bursts, all occurring on a massive NS.
4.3. The non-PRE bursts: A recurrence time consistency check
We performed a consistency check on the non-PRE bursts using their recurrence times. From the pre-burst persistent flux, the local mass accretion rate can be calculated via the relation (Galloway et al. 2008)
 (2)
(2)
where Fper is the persistent flux, d is the source distance, and the NS mass MNS = 1.4 M⊙ and radius RNS = 10 km. The results are listed in Table 3. Please note that ṁ can vary by ∼30% over a plausible range of NS parameters (MNS = 1.4 − 2.0 M⊙, RNS = 10 − 13 km). Nevertheless, this uncertainty does not alter the main conclusions presented below. The predicted recurrence time, Δtrec, depends on the ignition depth, yign, and the local mass accretion rate, ṁ,
Calculated parameters.
 (3)
(3)
and
 (4)
(4)
where the nuclear energy generated is Qnuc ≈ 1.31 + 6.95X − 1.92X2 MeV nucleon−1 ≈ 4.98 MeV nucleon−1 for a solar composition (X = 0.7) and Qnuc ≈ 1.31 MeV nucleon−1 for helium (X = 0; Goodwin et al. 2019). We used d = 6.62 ± 0.15 kpc to determine yign and Δtrec.
For burst #2, the observed recurrence time since burst #1 was 1.34 h. Assuming a mixed-fuel composition (X = 0.7), the observed fluence and persistent flux predict a recurrence time of 1.03 ± 0.26 h. This is in good agreement with the observed value, strongly supporting our conclusion that the non-PRE bursts are fueled by a hydrogen–helium mixture. We also computed the ratio of the persistent flux to the burst fluence, α = TrecFper/Eb, which is 66 ± 4 for burst #2, also consistent with a mixed hydrogen–helium burst (Li et al. 2021; Galloway et al. 2008).
In addition, we can examine the relation between the recurrence time (ΔTrec) and the local mass accretion rate (ṁ) across the entire outburst. Due to observational gaps, the ΔTrec is an upper limit on the true value. If N bursts were missed between two observed successive bursts, we corrected the observed recurrence time via ΔTrec/(N + 1). Specifically, we chose N = 0, 11, 199, 3, 21, and 7 for the six intervals between our seven observed bursts, with the largest number of missed bursts corresponding to the interval of burst #4. A power-law fit to these data reveals a strong anticorrelation,  (see Fig. 7).
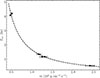 |
Fig. 7. Recurrence time versus local mass accretion rate. The dashed line represents the best-fit power-law model for all bursts: |
This single power-law fit effectively describes the overall trend across the outburst. However, it should be noted that this is a simplification. Theoretical models and prior observations indicate that the power-law index itself depends on the burning regime, with an expected index of approximately −1 for mixed hydrogen–helium bursts, steepening to ∼ − 3 for pure helium bursts (Cumming & Bildsten 2000; Chenevez et al. 2011; Linares et al. 2012; Li et al. 2018b). Our power-law index of −1.31 can be interpreted as a sample-averaged value across both regimes. While our dataset, which includes both burst types, is too small to constrain the indices for the different fuel compositions independently, the strong overall anticorrelation provides global support for our interpretation of the burst behavior.
4.4. A burning transition from mixed fuel to pure helium
Our analysis, combining burst morphology, distance constraints from PRE touchdown fluxes, and recurrence time calculations, paints a remarkably self-consistent picture of a fuel transition during the 2023 outburst of Terzan 5 X–3. The source began by producing mixed hydrogen–helium bursts from a hydrogen-rich accreted layer at accretion rates of 0.13−0.27 ṁEdd. As the outburst decayed and the accretion rate dropped to ∼ 0.03 ṁEdd, the burning regime transitioned. This observed behavior aligns with theoretical predictions, which place the transition threshold between these two burning regimes at ∼ 0.1 ṁEdd (Strohmayer & Bildsten 2006).
Observing a clear transition from a mixed-fuel to a pure-helium burning regime within a single outburst from NS LMXB is a rare phenomenon. In ultracompact X-ray binaries with helium-rich donors, such as 4U 1820–30, the accreted material is hydrogen-deficient by definition, so pure helium bursts are observed (Yu et al. 2024); in a rare case, it showed a super-burst powered by unstable carbon burning (Peng et al. 2025). However, bursting activity is not guaranteed. For instance, the ultracompact X-ray binary Swift J1756.9–2508 has undergone two well-monitored outbursts, but both were relatively faint and no thermonuclear bursts were detected at all (Li et al. 2021). However, some of these systems, at very low accretion rates (∼ 0.01 ṁEdd), can produce intermediate-duration bursts from the ignition of a thick helium layer (Lu et al. 2023). In these sources, a transition from mixed hydrogen and helium burning to helium-only burning is unlikely.
As systems where the mass accretion rate evolves significantly, transient LMXBs with hydrogen-rich donors are prime candidates for observing burning transition. Such a burning transition, driven by a decreasing accretion rate, has been explored in detail in a few transient LMXBs. Chenevez et al. (2011) studied a 6-month outburst of IGR J17473–2721 and identified a clear hysteresis in burst activity; mixed-fuel bursts dominated the rise, but after a month-long pause at the outburst peak, the bursting resumed with shorter, more energetic flashes consistent with pure helium burning with a lower persistent flux. Similarly, Linares et al. (2012) analyzed IGR J17480–2446 (also in Terzan 5) and found direct evidence of a transition between pure helium and mixed hydrogen–helium ignition regimes at a persistent luminosity of approximately 30% of the Eddington limit.
The monitoring of the Terzan 5 X–3 outburst by NICER was therefore crucial, even though the NICER observations only covered a low observational duty cycle of ∼5% during the outburst. It provided the rare opportunity to witness the thermonuclear burning evolution, offering a valuable chance for studying the interplay between the accretion rate and the conditions that trigger different thermonuclear bursts on NS surfaces.
5. Summary
We have presented a detailed analysis of seven thermonuclear X-ray bursts from Terzan 5 X–3 observed by NICER during its 2023 outburst. By performing a time-resolved spectral analysis for all seven bursts, we have uncovered a clear physical evolution in the thermonuclear burning process and the burst–disk interaction. We summarize the results as follows:
-
We classify the seven bursts into two distinct types: four standard non-PRE bursts and one PRE-candidate burst (burst #4) that occurred in a mixed hydrogen–helium environment, and two powerful PRE bursts powered by pure helium (bursts #6 and #7).
-
The strength of the interaction between the burst and the accretion disk, modeled with a persistent emission enhancement factor (fa), scales directly with the burst peak luminosity. The enhancement is absent (fa ≈ 1) in the faintest bursts, becomes modest (fa ≈ 1.5 − 2) for the more luminous non-PRE bursts and the mixed-fuel PRE candidate, and is very strong (fa ≈ 6 − 8) during the pure helium PRE events. This provides quantitative evidence that the Poynting-Robertson drag effect is a direct function of the burst’s radiative power.
-
We confirm a transition in the burning regime from mixed hydrogen–helium fuel to pure helium, which occurs as the persistent accretion rate drops below ∼0.1 ṁEdd, in agreement with theoretical predictions.
-
Our fuel composition and burst classifications are validated by a self-consistency check. The observed peak luminosities of both the mixed-fuel PRE candidate and the pure helium PRE bursts are consistent with reaching their respective, composition-dependent Eddington limits on the same massive NS of ∼2 M⊙.
Acknowledgments
This work was supported by the Major Science and Technology Program of Xinjiang Uygur Autonomous Region (No. 2022A03013-3), and the science and technology innovation Program of Hunan Province (No. 2024JC0001). Z.L. and Y.Y.P. were supported by National Natural Science Foundation of China (12273030). This research has made use of data obtained from the High Energy Astrophysics Science Archive Research Center (HEASARC), provided by NASA’s Goddard Space Flight Center.
References
- Altamirano, D., Wijnands, R., Heinke, C. O., Sivakoff, G. R., & Pooley, D. 2012, ATel, 4264, 1 [Google Scholar]
- Arnaud, K. A. 1996, ASP Conf. Ser., 101, 17 [Google Scholar]
- Bahramian, A., Heinke, C. O., Sivakoff, G. R., et al. 2014, ApJ, 780, 127 [Google Scholar]
- Bilous, A. V., & Watts, A. L. 2019, ApJS, 245, 19 [NASA ADS] [CrossRef] [Google Scholar]
- Bult, P., Jaisawal, G. K., Güver, T., et al. 2019, ApJ, 885, L1 [CrossRef] [Google Scholar]
- Chenevez, J., Altamirano, D., Galloway, D. K., et al. 2011, MNRAS, 410, 179 [NASA ADS] [CrossRef] [Google Scholar]
- Cumming, A., & Bildsten, L. 2000, ApJ, 544, 453 [Google Scholar]
- Degenaar, N., Wijnands, R., Bahramian, A., et al. 2015, MNRAS, 451, 2071 [NASA ADS] [CrossRef] [Google Scholar]
- Degenaar, N., Ballantyne, D. R., Belloni, T., et al. 2018, Space Sci. Rev., 214, 15 [Google Scholar]
- Dittmann, A. J., Miller, M. C., Lamb, F. K., et al. 2024, ApJ, 974, 295 [NASA ADS] [CrossRef] [Google Scholar]
- Frank, J., King, A., & Raine, D. 1992, Camb. Astrophys. Ser., 21 [Google Scholar]
- Fujimoto, M. Y., Hanawa, T., & Miyaji, S. 1981, ApJ, 247, 267 [NASA ADS] [CrossRef] [Google Scholar]
- Galloway, D. K., & Keek, L. 2021, Astrophys. Space Sci. Lib., 461, 209 [NASA ADS] [CrossRef] [Google Scholar]
- Galloway, D. K., Muno, M. P., Hartman, J. M., Psaltis, D., & Chakrabarty, D. 2008, ApJS, 179, 360 [NASA ADS] [CrossRef] [Google Scholar]
- Goodwin, A. J., Heger, A., & Galloway, D. K. 2019, ApJ, 870, 64 [NASA ADS] [CrossRef] [Google Scholar]
- Groth, E. J. 1975, ApJS, 29, 285 [Google Scholar]
- Heinke, C. O., Wijnands, R., Cohn, H. N., et al. 2006, ApJ, 651, 1098 [NASA ADS] [CrossRef] [Google Scholar]
- Heinke, C. O., Wijnands, R., Altamirano, D., Pooley, D., & Sivakoff, G. R. 2012, ATel, 4249, 1 [Google Scholar]
- Heinke, C. O., Homan, J., van den Berg, M., et al. 2023, ATel, 15953, 1 [Google Scholar]
- Kennea, J. A., Bahramian, A., Heinke, C., & Negoro, H. 2023, ATel, 15919, 1 [Google Scholar]
- Kiziltan, B., Kottas, A., De Yoreo, M., & Thorsett, S. E. 2013, ApJ, 778, 66 [NASA ADS] [CrossRef] [Google Scholar]
- Kuulkers, E., den Hartog, P. R., in’t Zand, J. J. M., et al. 2003, A&A, 399, 663 [NASA ADS] [CrossRef] [EDP Sciences] [Google Scholar]
- Lewin, W. H. G., van Paradijs, J., & Taam, R. E. 1993, Space Sci. Rev., 62, 223 [CrossRef] [Google Scholar]
- Li, Z., Suleimanov, V. F., Poutanen, J., et al. 2018a, ApJ, 866, 53 [NASA ADS] [CrossRef] [Google Scholar]
- Li, Z., De Falco, V., Falanga, M., et al. 2018b, A&A, 620, A114 [NASA ADS] [CrossRef] [EDP Sciences] [Google Scholar]
- Li, Z., Pan, Y., & Falanga, M. 2021, ApJ, 920, 35 [NASA ADS] [CrossRef] [Google Scholar]
- Li, Z., Yu, W., Lu, Y., Pan, Y., & Falanga, M. 2022, ApJ, 935, 123 [NASA ADS] [CrossRef] [Google Scholar]
- Linares, M., Altamirano, D., Chakrabarty, D., Cumming, A., & Keek, L. 2012, ApJ, 748, 82 [NASA ADS] [CrossRef] [Google Scholar]
- Lu, Y., Li, Z., Pan, Y., et al. 2023, A&A, 670, A87 [NASA ADS] [CrossRef] [EDP Sciences] [Google Scholar]
- Lu, Y., Li, Z., Yu, W., Pan, Y., & Falanga, M. 2024, ApJ, 969, 15 [NASA ADS] [CrossRef] [Google Scholar]
- Mahmoodifar, S., Strohmayer, T. E., Bult, P., et al. 2019, ApJ, 878, 145 [Google Scholar]
- Martsen, A. R., Ransom, S. M., DeCesar, M. E., et al. 2022, ApJ, 941, 22 [CrossRef] [Google Scholar]
- Miller, J. M., Maitra, D., Cackett, E. M., Bhattacharyya, S., & Strohmayer, T. E. 2011, ApJ, 731, L7 [NASA ADS] [CrossRef] [Google Scholar]
- Negoro, H., Iwakiri, W., Serino, M., et al. 2023, ATel, 15917, 1 [Google Scholar]
- Özel, F., Güver, T., & Psaltis, D. 2009, ApJ, 693, 1775 [Google Scholar]
- Peng, Z., Li, Z., Pan, Y., et al. 2025, ApJ, 982, 18 [NASA ADS] [CrossRef] [Google Scholar]
- Poutanen, J. 2017, ApJ, 835, 119 [NASA ADS] [CrossRef] [Google Scholar]
- Poutanen, J., Nättilä, J., Kajava, J. J. E., et al. 2014, MNRAS, 442, 3777 [Google Scholar]
- Remillard, R. A., Loewenstein, M., Steiner, J. F., et al. 2021, ArXiv e-prints [arXiv:2105.09901] [Google Scholar]
- Remillard, R. A., Loewenstein, M., Steiner, J. F., et al. 2022, AJ, 163, 130 [NASA ADS] [CrossRef] [Google Scholar]
- Sanna, A., Guillot, S., Gendreau, K., et al. 2023, ATel, 15922, 1 [Google Scholar]
- Strohmayer, T., & Bildsten, L. 2006, Camb. Astrophys. Ser., 39, 113 [Google Scholar]
- Strohmayer, T. E., & Markwardt, C. B. 2002, ApJ, 577, 337 [NASA ADS] [CrossRef] [Google Scholar]
- Strohmayer, T. E., Altamirano, D., Arzoumanian, Z., et al. 2019, ApJ, 878, L27 [NASA ADS] [CrossRef] [Google Scholar]
- Suleimanov, V., Poutanen, J., & Werner, K. 2011, A&A, 527, A139 [NASA ADS] [CrossRef] [EDP Sciences] [Google Scholar]
- Suleimanov, V., Poutanen, J., & Werner, K. 2012, A&A, 545, A120 [NASA ADS] [CrossRef] [EDP Sciences] [Google Scholar]
- Suleimanov, V. F., Poutanen, J., Nättilä, J., et al. 2017, MNRAS, 466, 906 [Google Scholar]
- Sztajno, M., Fujimoto, M. Y., van Paradijs, J., et al. 1987, MNRAS, 226, 39 [NASA ADS] [CrossRef] [Google Scholar]
- Vaughan, B. A., van der Klis, M., Wood, K. S., et al. 1994, ApJ, 435, 362 [NASA ADS] [CrossRef] [Google Scholar]
- Vinciguerra, S., Salmi, T., Watts, A. L., et al. 2024, ApJ, 961, 62 [NASA ADS] [CrossRef] [Google Scholar]
- Walker, M. A. 1992, ApJ, 385, 651 [NASA ADS] [CrossRef] [Google Scholar]
- Wijnands, R., Altamirano, D., Heinke, C. O., Sivakoff, G. R., & Pooley, D. 2012, ATel, 4242, 1 [Google Scholar]
- Worpel, H., Galloway, D. K., & Price, D. J. 2013, ApJ, 772, 94 [NASA ADS] [CrossRef] [Google Scholar]
- Worpel, H., Galloway, D. K., & Price, D. J. 2015, ApJ, 801, 60 [NASA ADS] [CrossRef] [Google Scholar]
- Yu, W., Li, Z., Lu, Y., et al. 2024, A&A, 683, A93 [NASA ADS] [CrossRef] [EDP Sciences] [Google Scholar]
- Yu, W., Li, Z., Pan, Y., et al. 2025, A&A, 696, A139 [NASA ADS] [CrossRef] [EDP Sciences] [Google Scholar]
- Zhao, G., Li, Z., Pan, Y., et al. 2022, A&A, 660, A31 [NASA ADS] [CrossRef] [EDP Sciences] [Google Scholar]
All Tables
All Figures
|
Fig. 1. The 2023 outburst light curves and hardness ratio of Terzan 5 X–3. The 2023 outburst began on MJD 60002 (2023 February 27). Upper panel: Light curves from NICER observations (0.5−10 keV, blue points) and MAXI (2−20 keV, black points). Lower panel: Hardness ratio, defined as the count rate ratio between 3.8−6.8 keV and 2.0−3.8 keV. Each data point represents 64 seconds of NICER data, with all bursts excluded. The dashed red lines indicate the type I X-ray bursts observed by NICER, and the dashed green line those observed by Chandra (Heinke et al. 2023). |
| In the text | |
|
Fig. 2. HID of Terzan 5 X–3 during the 2023 outburst from NICER observations. All bursts are removed, and each point represents a segment of 64 s. The HIDs of the persistent emission before each NICER X-ray burst are marked as red diamonds. The black arrow indicates the direction of the HID evolution. |
| In the text | |
|
Fig. 3. Light curves of the seven X-ray bursts from Terzan 5 X–3 observed with NICER. Black lines are light curves in 0.5−10 keV with time bins of 0.5 s. The vertical dotted line marks the onset time of each burst. The dashed-dotted gray line represents the persistent emission, which was subtracted from the bursts. |
| In the text | |
|
Fig. 4. Best-fitted parameters of the spectra from bursts #1−3 using the model TBabs × (bbodyrad + fa× (diskbb + bbodyrad)). From top to bottom: Bolometric blackbody flux (Fbb), blackbody temperature (kTbb), blackbody radius (Rbb), and the goodness of fit (χν2). In the bottom panel, the red and black lines indicate the χν2 with fa free and fixed at 1, respectively. Since allowing fa to vary did not improve the fit, it was fixed at 1. |
| In the text | |
|
Fig. 5. Same as Fig. 4 but for bursts #4 (left) and #5 (right). In the fourth panels, we show the factor fa, which was set as a free parameter, improving the fit. The vertical dashed line indicates the touchdown moment for the PRE candidate, burst #4. |
| In the text | |
|
Fig. 6. Same as Fig. 4 but for bursts #6 (left) and #7 (right). The vertical dashed line indicates the touchdown moment. |
| In the text | |
|
Fig. 7. Recurrence time versus local mass accretion rate. The dashed line represents the best-fit power-law model for all bursts: |
| In the text | |
Current usage metrics show cumulative count of Article Views (full-text article views including HTML views, PDF and ePub downloads, according to the available data) and Abstracts Views on Vision4Press platform.
Data correspond to usage on the plateform after 2015. The current usage metrics is available 48-96 hours after online publication and is updated daily on week days.
Initial download of the metrics may take a while.