Open Access
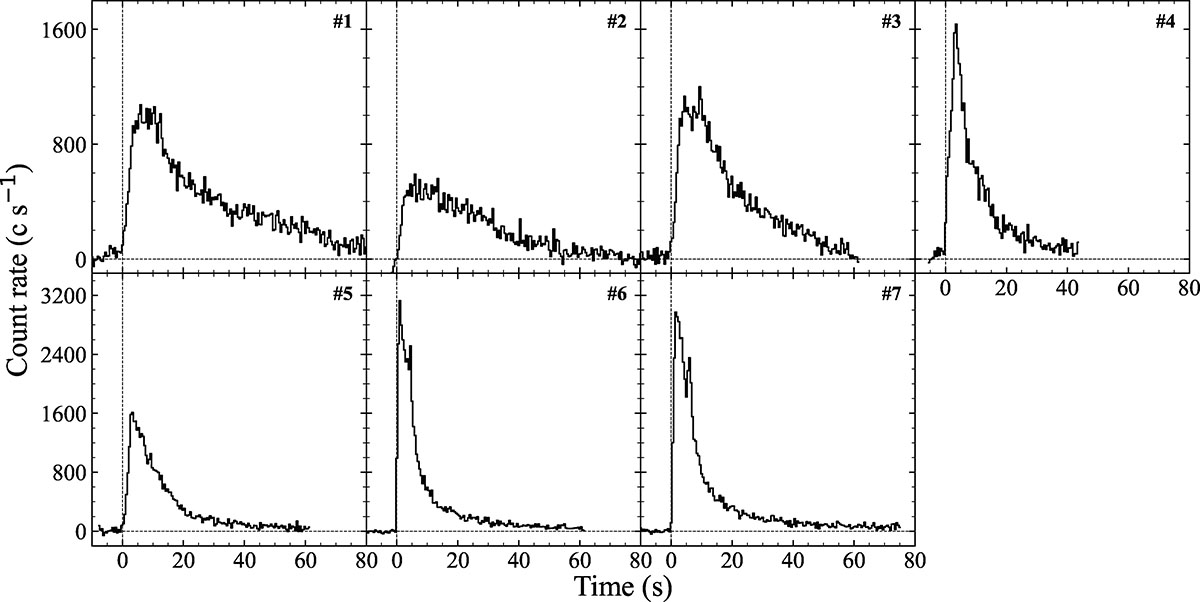
Fig. 3.
Download original image
Light curves of the seven X-ray bursts from Terzan 5 X–3 observed with NICER. Black lines are light curves in 0.5−10 keV with time bins of 0.5 s. The vertical dotted line marks the onset time of each burst. The dashed-dotted gray line represents the persistent emission, which was subtracted from the bursts.
Current usage metrics show cumulative count of Article Views (full-text article views including HTML views, PDF and ePub downloads, according to the available data) and Abstracts Views on Vision4Press platform.
Data correspond to usage on the plateform after 2015. The current usage metrics is available 48-96 hours after online publication and is updated daily on week days.
Initial download of the metrics may take a while.