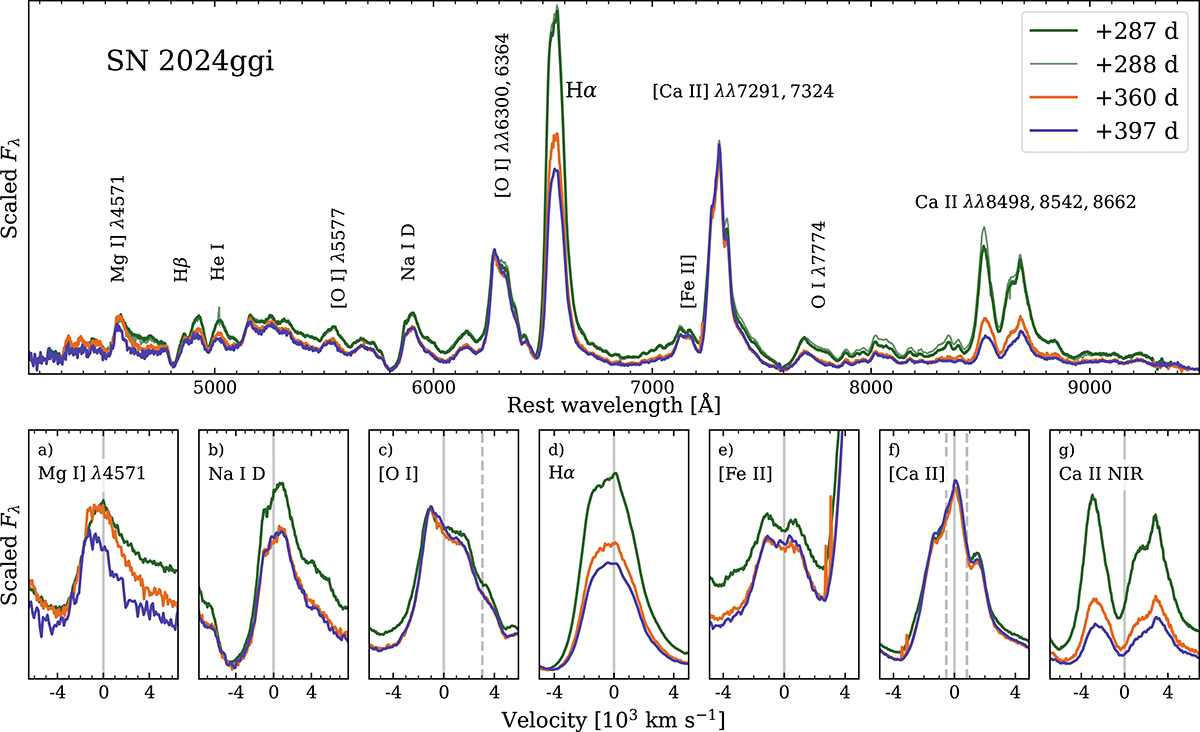
Fig. 1.
Download original image
Top panel: SN 2024ggi nebular spectra at 287, 288, 360, and 396 days after the explosion. The 288 d (GMOS) spectrum is plotted with a thin line as it is almost the same epoch as the 287 d (IMACS) spectrum (we do not combine them as they were taken with different instruments). Bottom panels: Line profiles at 287, 360, and 396 days in the velocity space for (a) Mg I]λ4571, (b) Na I D, (c) [O I]λλ6300, 6364, (d) Hα, (e) [Fe II]λ7155, f) [Ca II]λλ7291, 7324, and (g) Ca II T. For the purposes of visualization, all the spectra are scaled to the maximum emission in the [O I] region.
Current usage metrics show cumulative count of Article Views (full-text article views including HTML views, PDF and ePub downloads, according to the available data) and Abstracts Views on Vision4Press platform.
Data correspond to usage on the plateform after 2015. The current usage metrics is available 48-96 hours after online publication and is updated daily on week days.
Initial download of the metrics may take a while.