Fig. 4.
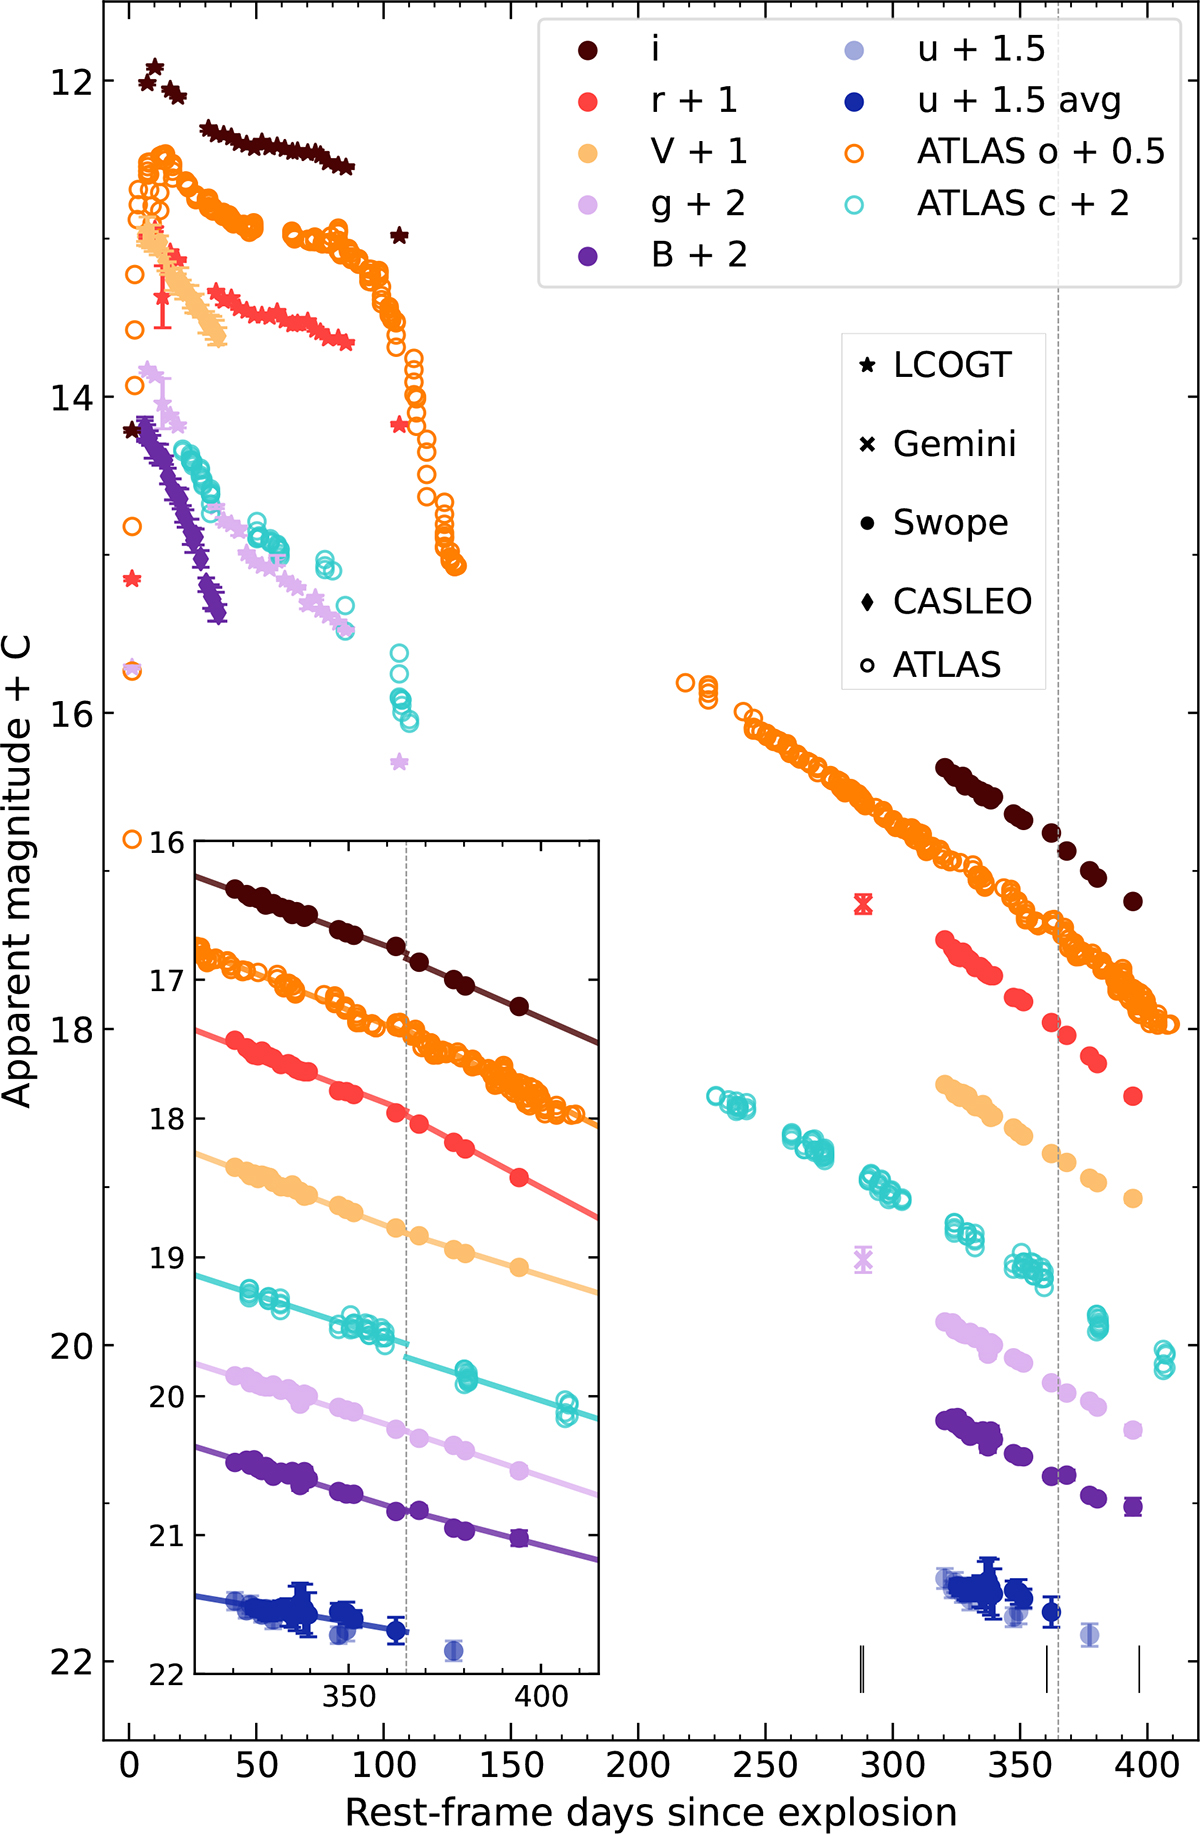
Download original image
Optical light curves of SN 2024ggi. The new data published in this work correspond to the Gemini and Swope telescopes. The early phase data is reported in Ertini et al. (2025). The black vertical lines indicate the phases of the four spectra presented in this work. The dotted gray line indicates the epoch where the o-, r-, and i-band light curves show a slope break, also noticeable in the ATLAS o-band light curve (see Sect. 4). Inset shows an expanded view of the temporal evolution between 320 − 415 days, highlighting the change in decline rate. Solid lines represent separate linear fits to the data before and after 365 days (marked by the vertical dotted line).
Current usage metrics show cumulative count of Article Views (full-text article views including HTML views, PDF and ePub downloads, according to the available data) and Abstracts Views on Vision4Press platform.
Data correspond to usage on the plateform after 2015. The current usage metrics is available 48-96 hours after online publication and is updated daily on week days.
Initial download of the metrics may take a while.