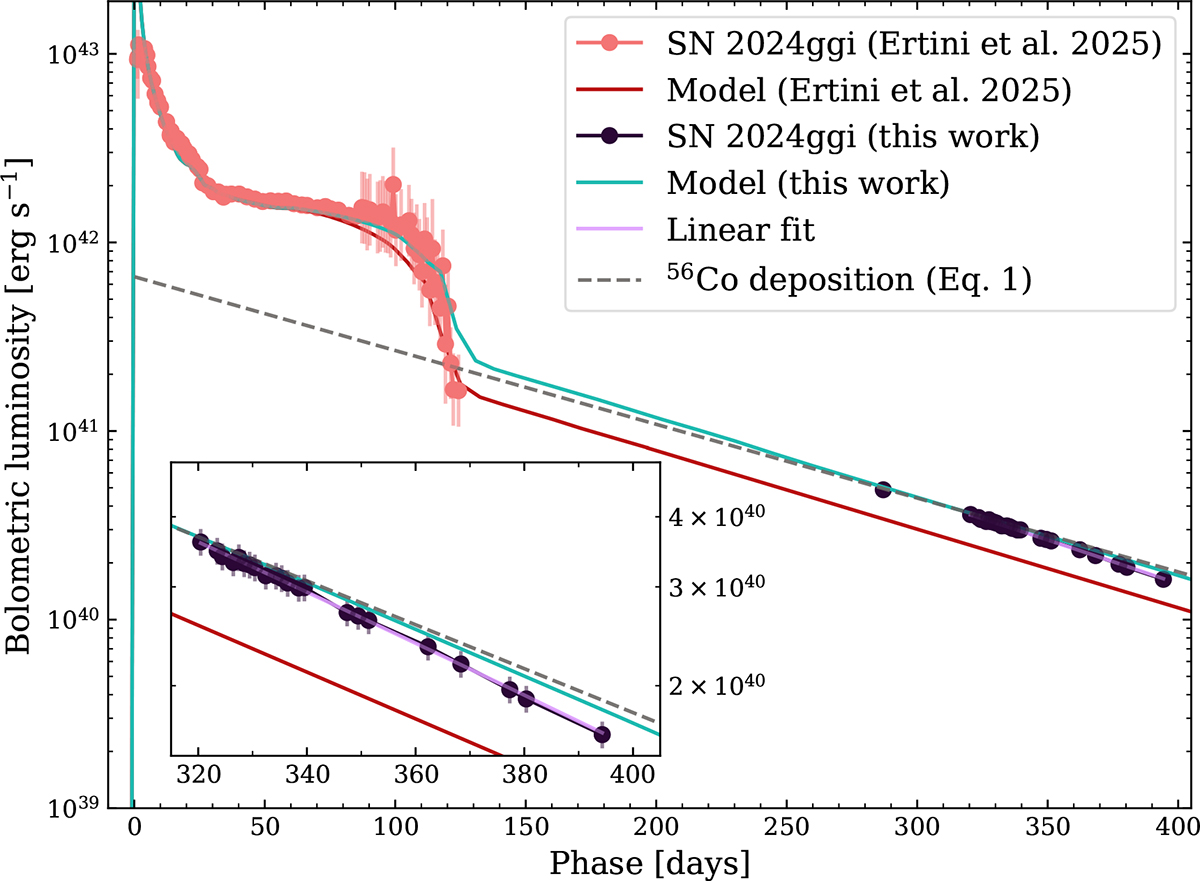
Fig. 5.
Download original image
Bolometric light curve of SN 2024ggi. The bolometric light curve published in Ertini et al. (2025) and their preferred model are plotted in pink dots and line, respectively. Our fitting of Eq. (1) is shown in purple. A new hydrodynamical model with the same parameters as those presented in Ertini et al. (2025), but with a larger 56Ni mass of 0.052 M⊙ is shown in the cyan line. The dashed gray line indicates the decay with a 56Ni mass of 0.049 M⊙ and full-trapping of γ rays.
Current usage metrics show cumulative count of Article Views (full-text article views including HTML views, PDF and ePub downloads, according to the available data) and Abstracts Views on Vision4Press platform.
Data correspond to usage on the plateform after 2015. The current usage metrics is available 48-96 hours after online publication and is updated daily on week days.
Initial download of the metrics may take a while.