Fig. 7.
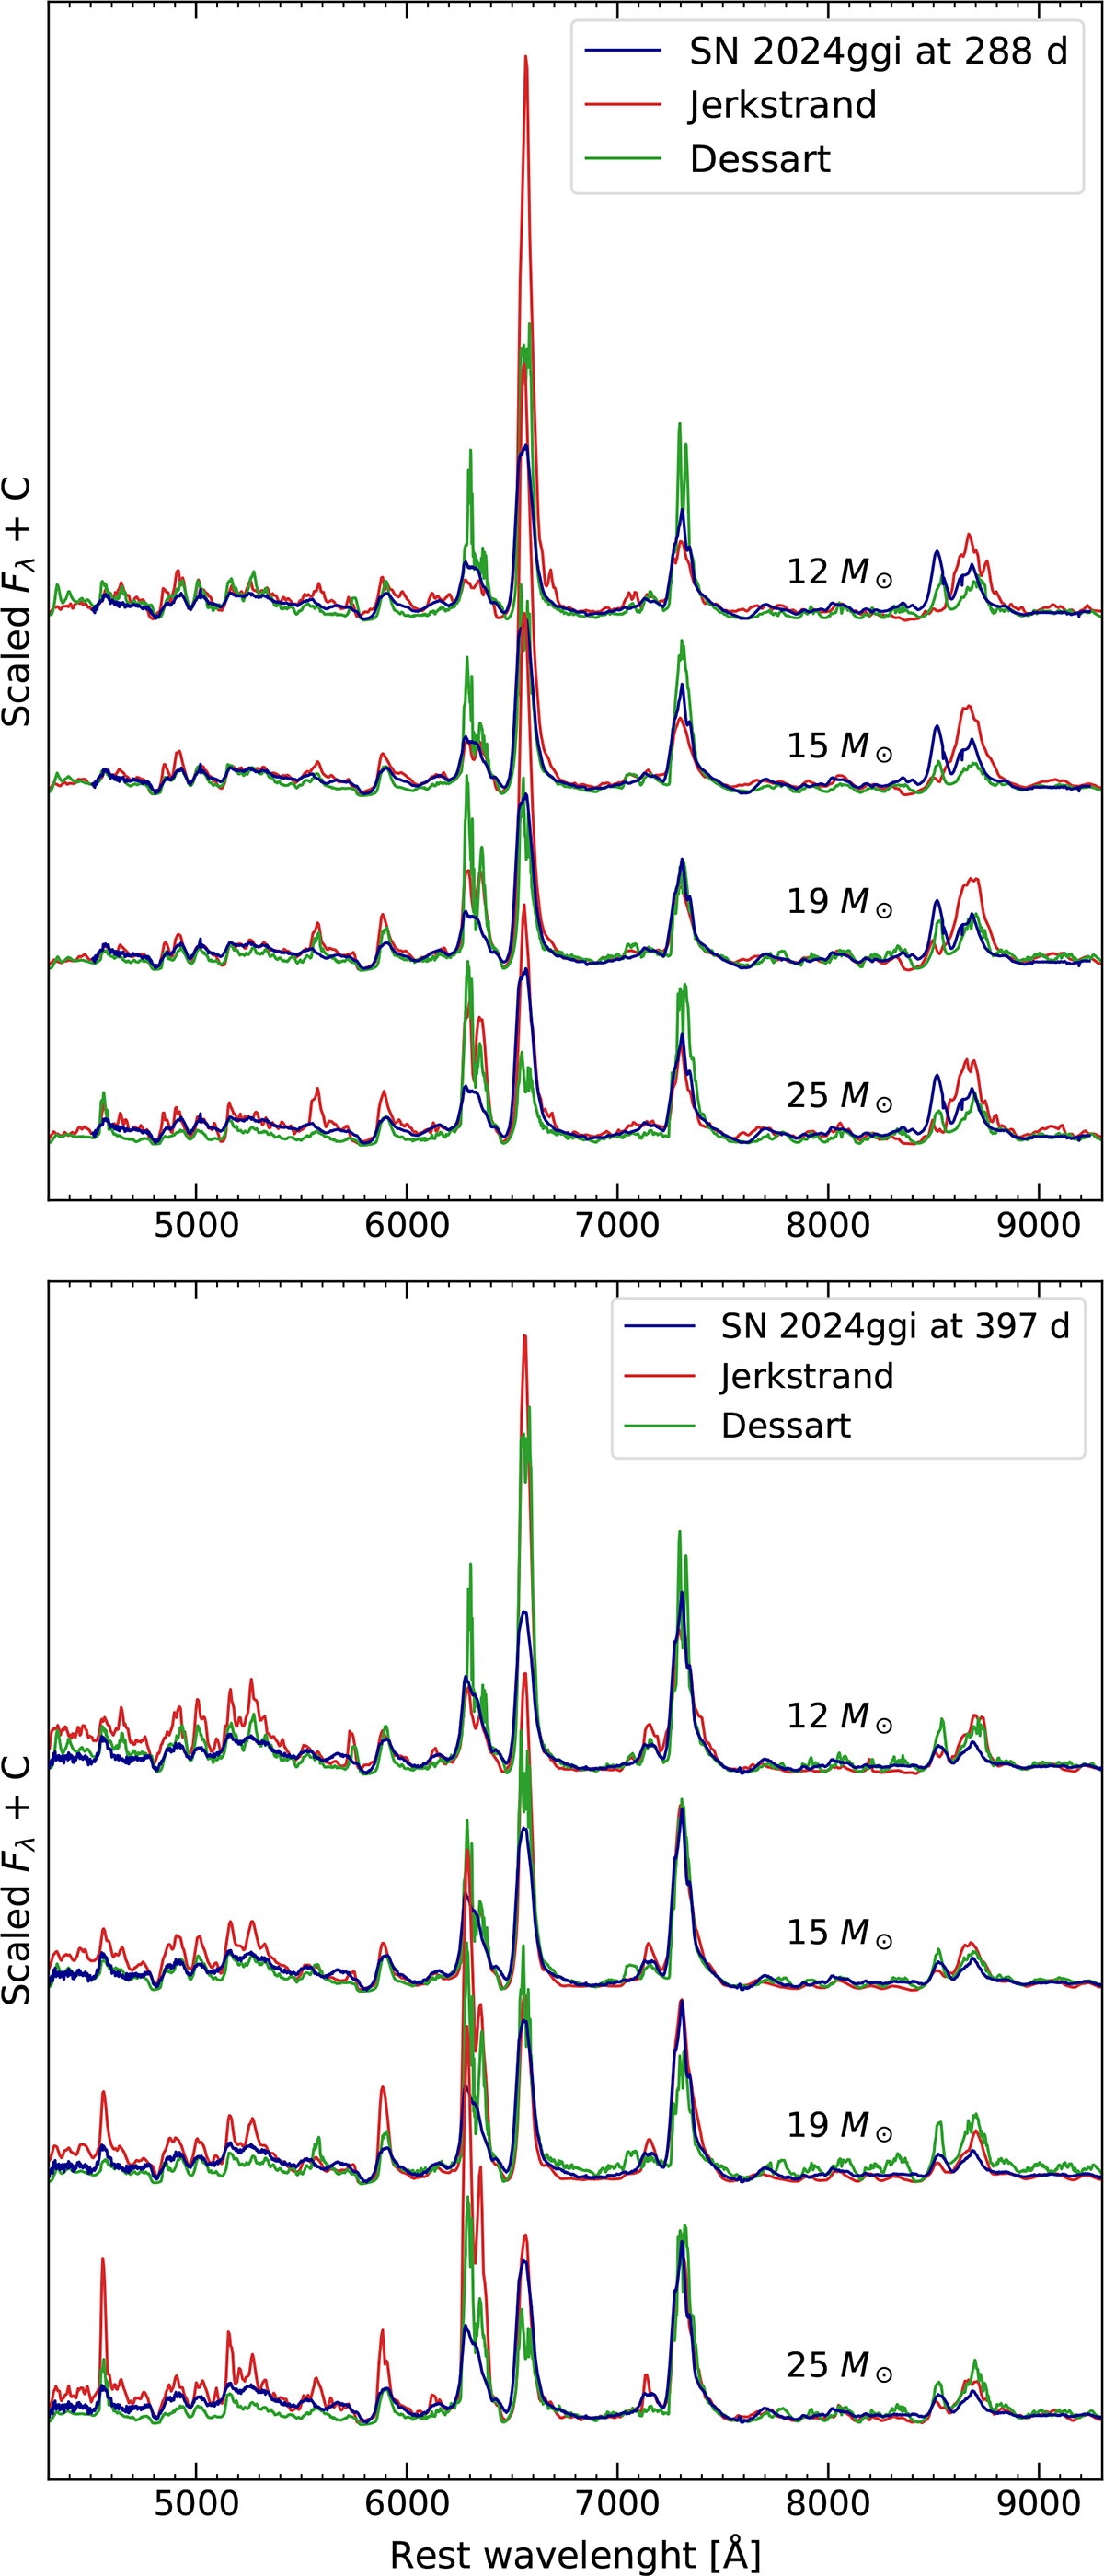
Download original image
SN 2024ggi in comparison with synthetic spectra from Jerkstrand et al. (2014) and Dessart et al. (2021). All the spectra are scaled by the mean value between 6900 − 8200 Å as an indication of the continuum. The upper plot shows the spectra at 288 days, while the synthetic spectra phases are 360 and 250 days for the Dessart et al. (2021) and Jerkstrand et al. (2014) models, respectively. In the bottom plot, we show our last spectrum at 396 days, this time changing spectra from Jerkstrand et al. (2014) with those at the phase of 400 days.
Current usage metrics show cumulative count of Article Views (full-text article views including HTML views, PDF and ePub downloads, according to the available data) and Abstracts Views on Vision4Press platform.
Data correspond to usage on the plateform after 2015. The current usage metrics is available 48-96 hours after online publication and is updated daily on week days.
Initial download of the metrics may take a while.