Fig. 1
Download original image
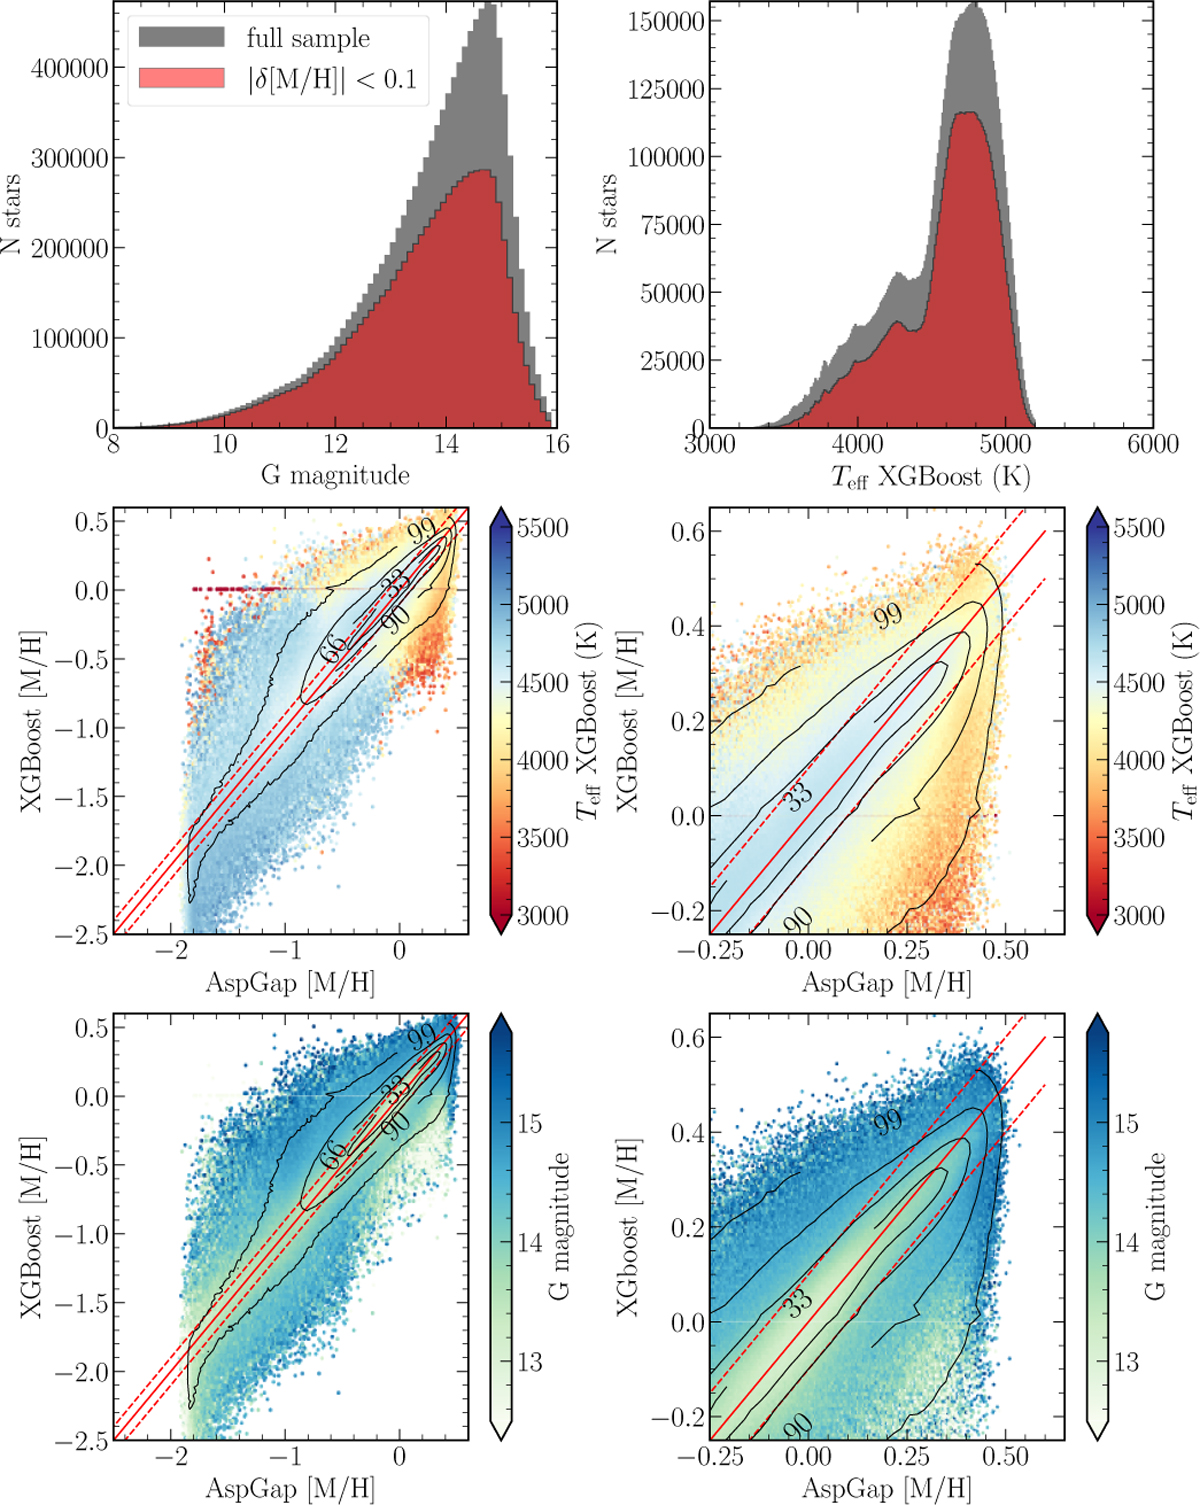
Top: G-magnitude distributions (left) and Teff distributions (right) of the total XGBoost sample cross-matched with AspGap (in grey) and the subsample for which differences in metallicity are smaller than 0.1 dex (in red); see Sect. 2. Middle left: comparison between the XGBoost and the AspGap metallicities, colour-coded by Teff. Middle right: zoomed-in view of the high-metallicity regime. Bottom: same as the middle plots but colour-coded by the G magnitude. Black contour lines represent 33, 66, 90, and 99% of the sample. The solid red line represents the 1:1 relation, whereas the dashed ones are shifted by ±0.1 dex.
Current usage metrics show cumulative count of Article Views (full-text article views including HTML views, PDF and ePub downloads, according to the available data) and Abstracts Views on Vision4Press platform.
Data correspond to usage on the plateform after 2015. The current usage metrics is available 48-96 hours after online publication and is updated daily on week days.
Initial download of the metrics may take a while.