Fig. 3
Download original image
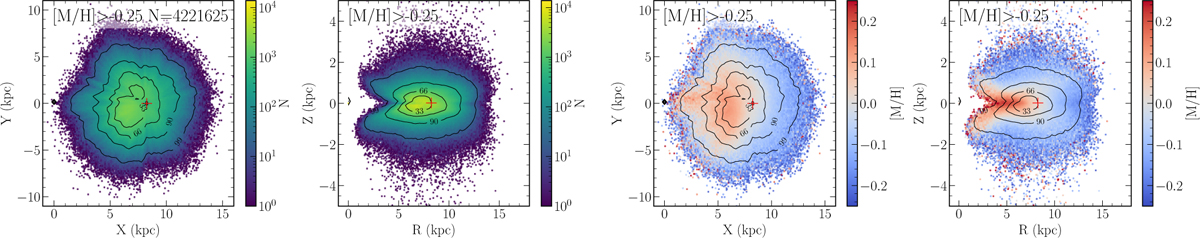
Spatial distribution of stars with [M/H] > −0.25 in face-on view (X-Y, panels 1 and 3) and edge-on view (R-Z, panels 2 and 4) after the selections described in Sect. 2. The position of the Sun is indicated by a red ‘+’ sign, at R = 8.249 kpc. The plots are colour-coded by the number of stars (left two panels) or the average metallicity (right two panels). Iso-contour lines containing 33, 66, 90, and 99% of the distribution are plotted in each panel.
Current usage metrics show cumulative count of Article Views (full-text article views including HTML views, PDF and ePub downloads, according to the available data) and Abstracts Views on Vision4Press platform.
Data correspond to usage on the plateform after 2015. The current usage metrics is available 48-96 hours after online publication and is updated daily on week days.
Initial download of the metrics may take a while.