Open Access
Fig. 1.
Download original image
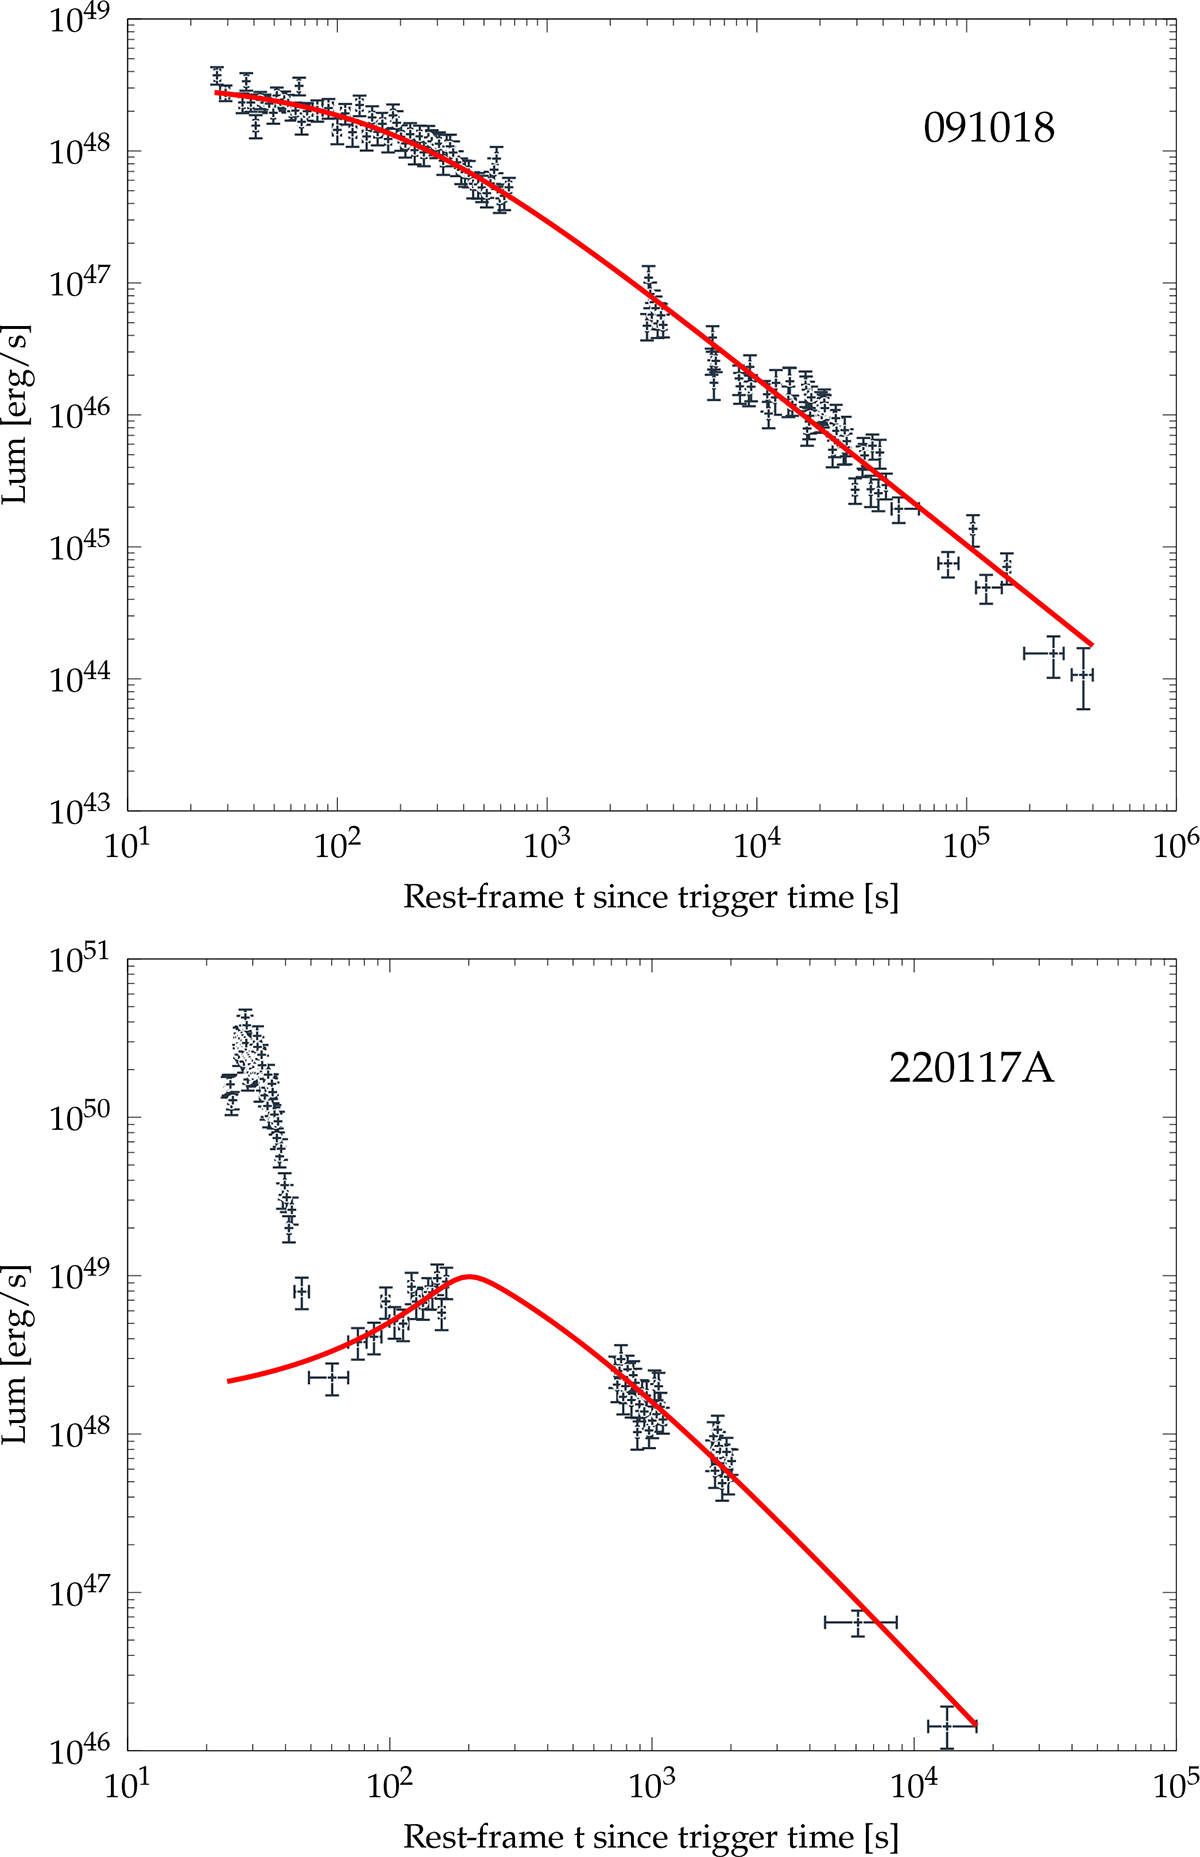
Top: Example of an LC successfully modelled with Eq. (1). Bottom: Example of an LC, exhibiting a peak following steep decay, modelled with Eq. (4) as the afterglow rise caused by the deceleration of the relativistic ejecta. This example is one of the four out of nine GRBs whose rise was successfully modelled as RS emission.
Current usage metrics show cumulative count of Article Views (full-text article views including HTML views, PDF and ePub downloads, according to the available data) and Abstracts Views on Vision4Press platform.
Data correspond to usage on the plateform after 2015. The current usage metrics is available 48-96 hours after online publication and is updated daily on week days.
Initial download of the metrics may take a while.