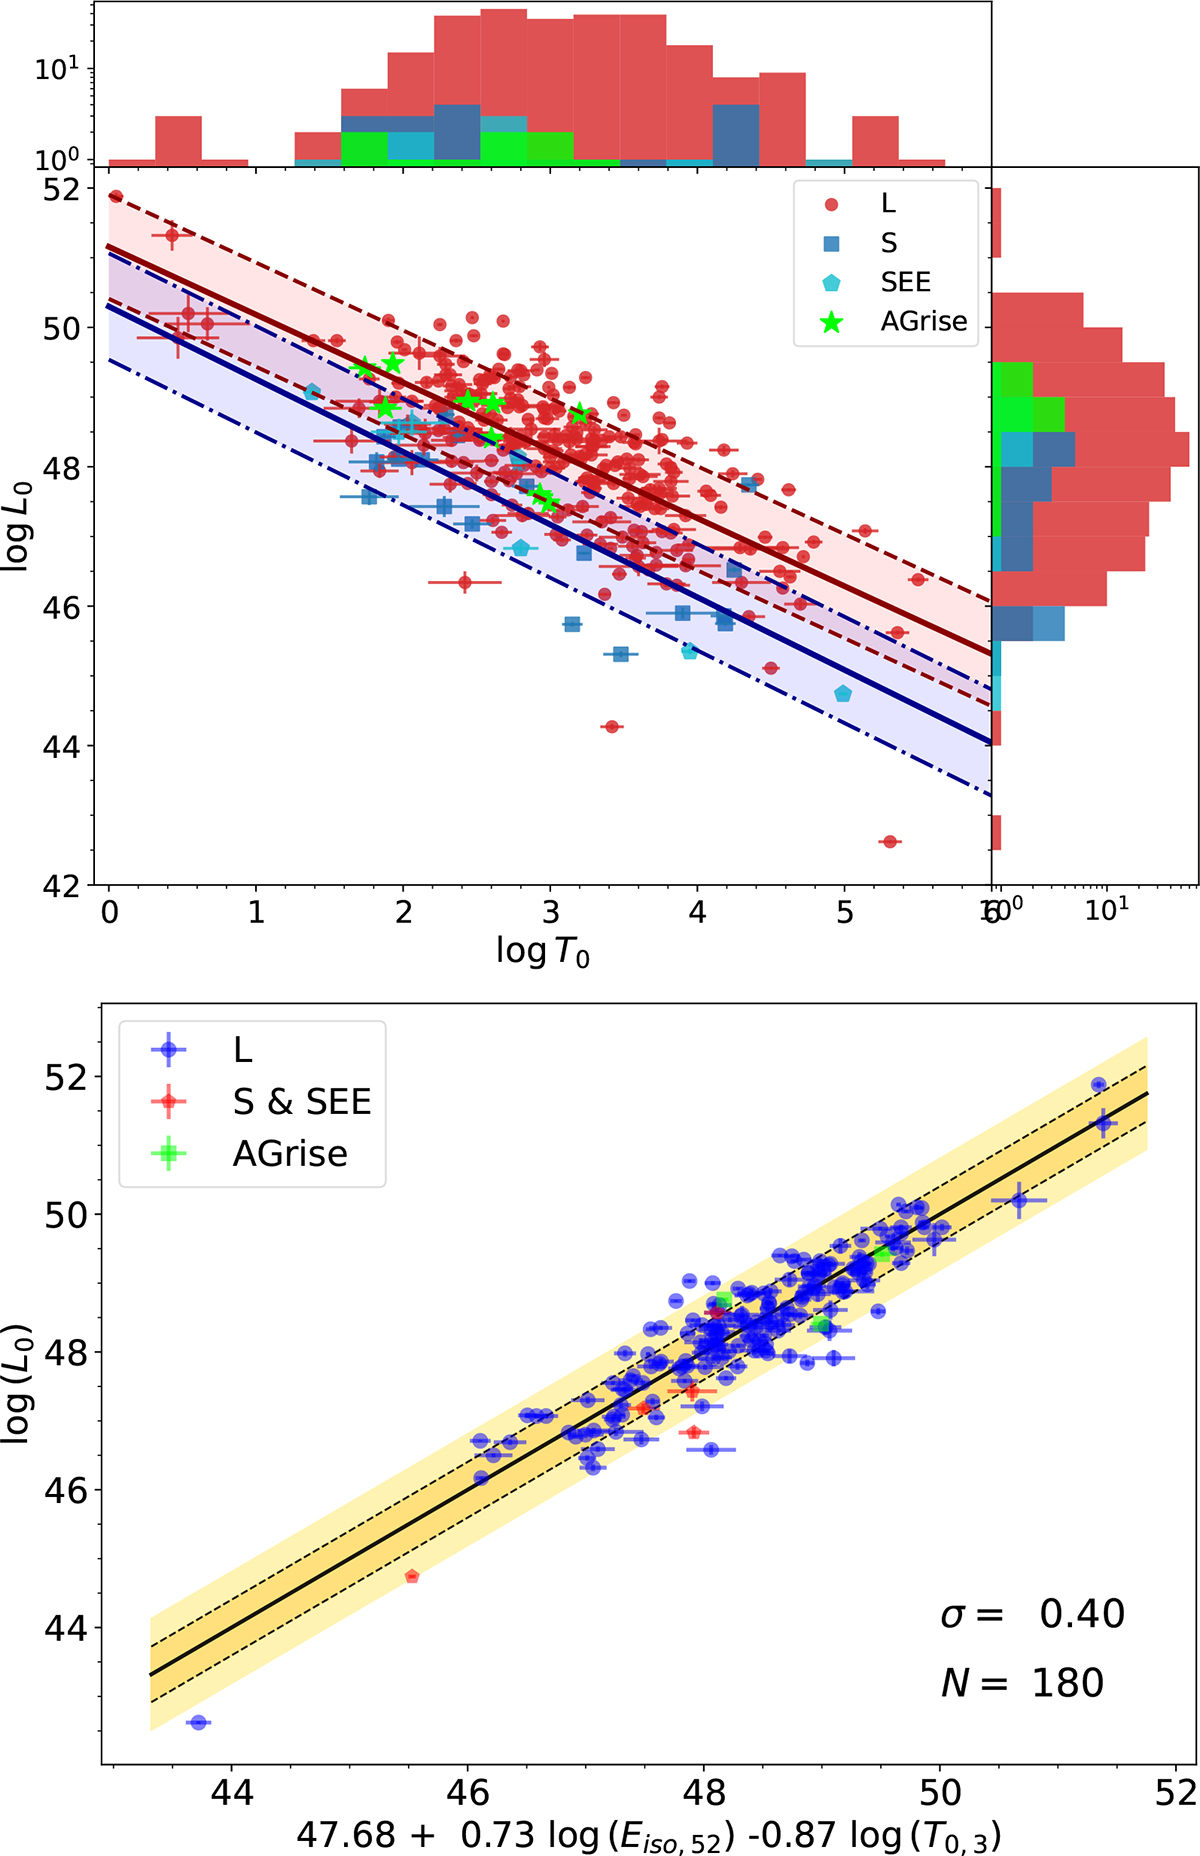
Fig. 2.
Download original image
Top: L0 vs. T0 for two separate groups: (i) L-GRBs (red circles, excluding the AG-rise cases), whose best-fit PL and 1σ uncertainty regions are shown by the solid red line and red-shaded area, respectively; (ii) S + SEE-GRBs (blue squares and cyan pentagons, respectively), whose best-fit PL is shown by the solid blue line within the blue-shaded area of the 1σ region. The L-GRBs of the AG-rise sample (green stars) were not used for the modelling. Also shown are the corresponding marginalised distributions. Bottom: L0-T0-Eγ, iso relation for the 180 GRBs with accurate measurements available, along with the best-fit model and 2σ uncertainty region.
Current usage metrics show cumulative count of Article Views (full-text article views including HTML views, PDF and ePub downloads, according to the available data) and Abstracts Views on Vision4Press platform.
Data correspond to usage on the plateform after 2015. The current usage metrics is available 48-96 hours after online publication and is updated daily on week days.
Initial download of the metrics may take a while.