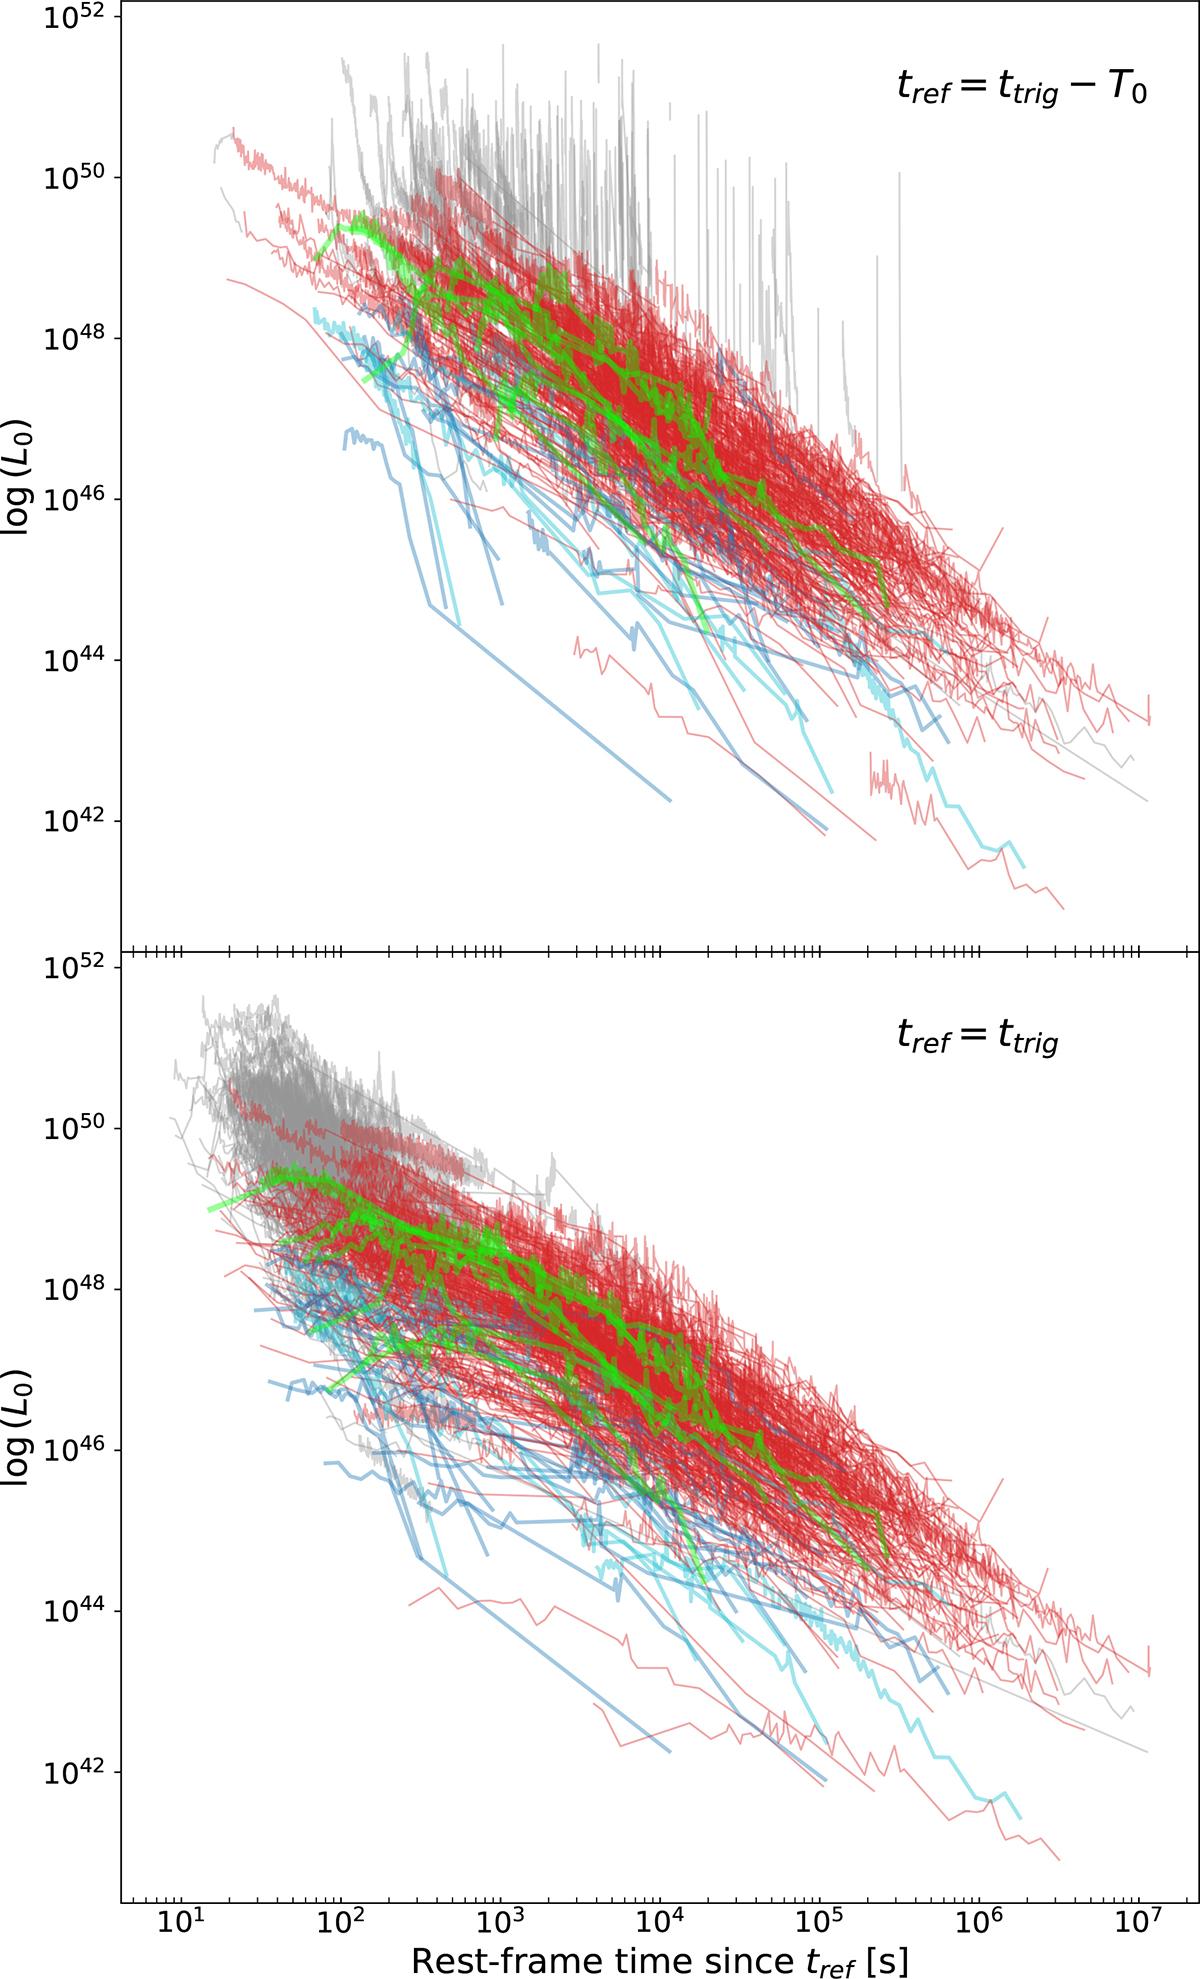
Fig. 4.
Download original image
Top: All the LCs displayed by shifting the rest-frame zero time backwards by T0. Red, blue, cyan, and green lines correspond to L-GRBs, S-GRBs, SEE-GRBs, and AG-rise cases, respectively. The grey portions were ignored by the modelling, being interpreted as internal activity. Bottom: Same data as in the top panel, except with the reference time coinciding with the BAT trigger time.
Current usage metrics show cumulative count of Article Views (full-text article views including HTML views, PDF and ePub downloads, according to the available data) and Abstracts Views on Vision4Press platform.
Data correspond to usage on the plateform after 2015. The current usage metrics is available 48-96 hours after online publication and is updated daily on week days.
Initial download of the metrics may take a while.