Open Access
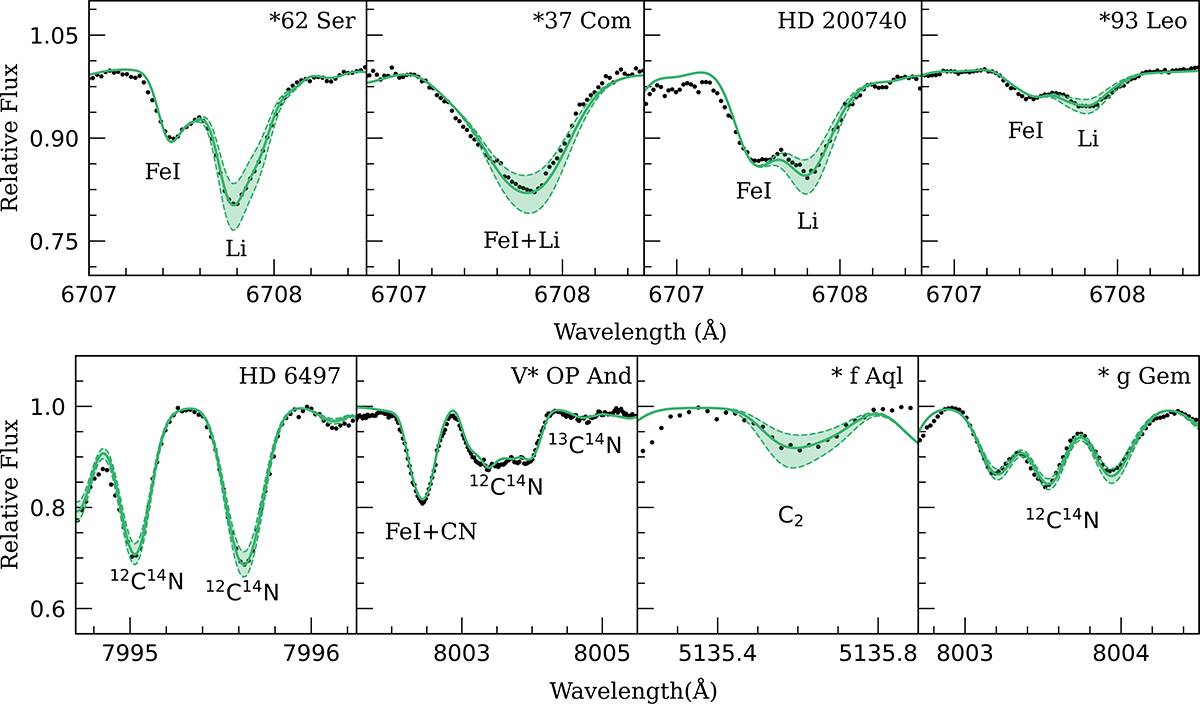
Fig. 1.
Download original image
Examples of synthetic spectrum fits to the Li I line, C2 band heads at 5135 Å, and the CN bands at 7995 Å and 8003 Å. Black dots represent the observed spectra, while solid green lines depict the best-fit synthetic spectra. The shaded region around the fit indicates the ±0.10 dex abundance range.
Current usage metrics show cumulative count of Article Views (full-text article views including HTML views, PDF and ePub downloads, according to the available data) and Abstracts Views on Vision4Press platform.
Data correspond to usage on the plateform after 2015. The current usage metrics is available 48-96 hours after online publication and is updated daily on week days.
Initial download of the metrics may take a while.