| Issue |
A&A
Volume 703, November 2025
|
|
|---|---|---|
| Article Number | A128 | |
| Number of page(s) | 13 | |
| Section | Stellar structure and evolution | |
| DOI | https://doi.org/10.1051/0004-6361/202556683 | |
| Published online | 13 November 2025 | |
Chromospherically active stars: Lithium and CNO abundances in northern RS CVn stars
Vilnius University, Faculty of Physics, Institute of Theoretical Physics and Astronomy, Saulėtekio av. 3, 10257 Vilnius, Lithuania
⋆ Corresponding author: This email address is being protected from spambots. You need JavaScript enabled to view it.
Received:
31
July
2025
Accepted:
9
September
2025
Abstract
Aims. We carried out a detailed investigation of Lthium and CNO abundances, including carbon isotope ratios, in RS CVn stars to assess the role of magnetic activity in the mixing of stellar atmospheres.
Methods. We obtained high-resolution spectra at the Moletai Astronomical Observatory. Lithium abundances were determined by spectral synthesis of the 6707 Å line and the CNO abundances using the C2 band heads at 5135 and 5635.5 Å, CN bands at 6470–6490 Å and 7980–8005 Å, and the [O I] line at 6300 Å. By fitting the 13CN band at 8004.7 Å, we determined the carbon isotope ratios.
Results. We determined the main atmospheric parameters and investigated the chemical composition of 32 RS CVn stars. Lithium abundances were determined for 13 additional stars using archival spectra. We report that *iot Gem and HD 179094 have carbon isotope ratios already affected by extra-mixing, even though they are in the evolutionary stage below the red giant branch luminosity bump. About half of the low-mass giants, for which the lithium abundance was determined, follow the first dredge-up predictions; however, other stars show reduced Lithium abundances, as predicted by thermohaline-induced mixing. The intermediate-mass stars show reduced Lithium abundances reduced, as predicted by rotation-induced mixing.
Conclusions. In low-mass, chromospherically active RS CVn stars, extra-mixing of lithium and carbon isotopes may begin earlier than in normal giants. The Li-rich RS CVn giant V*OP And has large C/N and carbon isotope ratios and raises questions about the origin of its lithium enhancement.
Key words: stars: abundances / stars: evolution / stars: magnetic field
© The Authors 2025
 Open Access article, published by EDP Sciences, under the terms of the Creative Commons Attribution License (https://creativecommons.org/licenses/by/4.0), which permits unrestricted use, distribution, and reproduction in any medium, provided the original work is properly cited.
This article is published in open access under the Subscribe to Open model. This email address is being protected from spambots. You need JavaScript enabled to view it. to support open access publication.
1. Introduction
Lithium occupies a unique niche in astrophysics owing to its intricate nucleosynthetic origins, its susceptibility to destruction during stellar evolution, and its role as an indicator of stellar interior conditions. In the early Universe, Big Bang nucleosynthesis (BBN) forged the lightest nuclei, synthesising deuterium, 3He, 4He, and 7Li. A widely accepted primordial Lthium abundance of A(Li)≃2.72 dex was estimated by Cyburt et al. (2008) and later increased to A(Li)≃2.75 dex by Pitrou et al. (2018). However, observations of halo dwarfs (−2.4 < [Fe/H] < −1.5, 5500 < Teff < 6250 K) by Spite & Spite (1982) yielded a smaller and constant A(Li)≃2.05 dex, the so-called ‘Spite plateau’. Norris et al. (2023) comprehensively reviewed later developments in primordial lithium, the Spite plateau, and ‘lithium meltdown’ investigations. Here, we highlight the discovery of a thin lithium plateau at A(Li)≃1.09 ± 0.01 dex among metal-poor, lower red giant branch (RGB) stars (Mucciarelli et al. 2022). Researchers also discovered a small fraction of Li-poor stars with A(Li) lower than ∼0.7 dex. The lithium observed in the present-day Universe is only in part the Lithium that was originally produced during the Big Bang. Its abundance is modified by a number of constructive and destructive processes that make Lithium one of the elements with the most complex histories. Measuring the amount of lithium depletion requires knowledge of both the initial and current abundances. The abundance of A(Li)1 = 3.26 dex, currently found in the interstellar medium and Solar System meteorites, is considered the reference limit for Population I dwarf stars (Asplund et al. 2009), while the Lithium abundance of red giant stars is expected to decrease to a value A(Li)∼1.5 dex or less.
Lithium abundances gradually begin to decrease during the pre-main sequence, then decline further in the main sequence, during the first dredge-up (1DUP) at the base of the RGB, and then again at the RGB luminosity bump (see, e.g. the reviews by Pinsonneault 1997; Lyubimkov 2016; Randich & Magrini 2021).
Lithium is fragile in stellar interiors, surviving only up to ∼2.5 × 10⁶ K at typical envelope main-sequence densities. During the 1DUP process (Iben 1968), the convective envelope deepens significantly, combining cooler lithium-containing material with hotter lithium-depleted layers, diluting the observable photospheric lithium abundance.
Studies of stellar mixing have examined both rotational effects (Palacios et al. 2003; Chanamé et al. 2005) and effects of magnetic fields (Busso et al. 2007; Nordhaus et al. 2008). Thermohaline mixing, as detailed in Eggleton et al. (2006, 2008), Charbonnel & Zahn (2007), Cantiello & Langer (2010), Charbonnel & Lagarde (2010), Charbonnel et al. (2017), adds further complexity by interacting with rotation.
Moreover, observations show that lithium can also be produced by stars or acquired externally (Smiljanic et al. 2018; Casey et al. 2019; Magrini et al. 2021a; Martell et al. 2021; Soares-Furtado et al. 2021; Sayeed et al. 2024 and references therein). About 1.2–2.2% of red giants have lithium levels that exceed theoretical estimates (Gao et al. 2019; Casey et al. 2019; Charbonnel et al. 2020). Proposed mechanisms include Lithium production via the Cameron–Fowler mechanism in asymptotic giant branch (AGB) stars (Cameron & Fowler 1971; Sackmann & Boothroyd 1992), nova outbursts (Starrfield et al. 1978; Vigroux & Arnould 1979; Izzo et al. 2015; Molaro et al. 2016; Rukeya et al. 2017), and cosmic-ray spallation (Reeves et al. 1970; Olive & Schramm 1992). Several studies have attributed lithium enrichment to a particular phase of stellar evolution (Kumar et al. 2020; Mallick et al. 2023) or to alternative mechanisms such as rotation-driven mixing (Denissenkov & Herwig 2004), magnetic buoyancy (Busso et al. 2007; Nordhaus et al. 2008; Guandalini et al. 2009), engulfment of planets (Villaver & Livio 2009; Adamów et al. 2012), and interactions with substellar companions (King et al. 1997; Israelian et al. 2004). Many other studies and reviews have explored these and other channels, but no single mechanism alone can explain the full diversity of observed lithium abundances.
Our study aimed to investigate how stellar magnetic activity influences the lithium content in the atmospheres of RS Canum Venaticorum (RS CVn) stars. First characterised by Hall et al. (1976) and later refined by Fekel et al. (1986), RS CVn systems comprise close binaries in which at least one cool component exhibits vigorous magnetic activity. This activity produces dark photospheric spots that cover significant fractions of the stellar surface and strong chromospheric emission lines (Walter et al. 1980). Consequently, RS CVn–type stars exhibit significantly greater activity than single stars of identical mass and age (Cao & Gu 2025). These systems display intense multi-wavelength activity, including coherent radio emission, X-ray flares, and optical variability, often manifested as energetic flare events that reflect their dynamic atmospheres and complex magnetic fields (e.g. Rucinski et al. 1993; White et al. 1978; Toet et al. 2021; Cao et al. 2023). They also show a pronounced emission in Ca II H&K lines and the Balmer Hα line, a hallmark of chromospheric activity that earned them the designation of chromospherically active binaries. Popper & Ulrich (1977) demonstrated that RS CVn systems are post-main-sequence objects that have just recently evolved out of the main sequence. Unlike main-sequence objects of spectral types later than about G8 to K0, where convective mixing largely depletes Li, the detection of the Li I 6707 Å resonance doublet in RS CVn primaries (which is otherwise extremely rare in stars of types later than about G8 due to increasingly deep convective zones) signifies incomplete depletion caused by hindered mixing from rapid rotation or recent lithium production or enrichment (Herbig 1965; Soderblom 1984; Randich et al. 1992).
In a survey of southern RS CVn binaries and other chromospherically active stars, Pallavicini et al. (1992) measured the Li I 6707 Å line and used curves of growth in a sample dominated by K-type stars. They found that many RS CVn stars exhibit high lithium abundances well above those of inactive field stars of the same spectral type. To verify this finding, Randich et al. (1993) performed a detailed spectrum synthesis of the RS CVn stars and confirmed a systematic lithium overabundance relative to field giants. They found a clear dependence of lithium on effective temperature, but only weak correlations with projected rotational velocity and chromospheric activity, and found no spectroscopic evidence for fresh lithium production via spallation. Randich et al. (1994) used high-resolution spectra of northern RS CVn stars to search for flare-induced lithium signatures, but detected none. Their results showed that tidal locking and enhanced magnetic activity suppress deep convective mixing, inhibiting lithium depletion, and explaining the enhanced surface abundances without invoking ongoing lithium synthesis. They also suggested that more information can be obtained by comparing the lithium and carbon isotope 12C/13C ratio of chromospherically active stars with normal inactive giants and subgiants.
Notably, earlier investigations of RS CVn stars frequently lacked measurements of CNO abundances, carbon isotope ratios, and stellar mass determinations, which are critical for studying mixing in evolved stars. Our paper fills this gap by presenting these measurements.
We observed high-resolution spectra for a sample of 32 RS CVn stars and investigated the abundances of lithium, carbon isotopes 12C and 13C, nitrogen, oxygen, and magnesium. In addition, we used the archival spectra from Bale et al. (2025) (hereafter Paper I), in which we determined the atmospheric parameters, CNO abundances, and carbon isotope ratios, to derive the lithium abundances for 13 additional RS CVn stars.
The layout of this work is as follows. Sect. 2 describes how we selected our RS CVn targets, obtained high-resolution spectra, and derived stellar parameters, element and carbon isotope abundances, masses, and kinematics. Section 3 outlines our empirical findings and their interpretation: an examination of extra-mixing in RS CVn stars, evaluation of chemical abundance trends, comparative analysis with theoretical models and observations of inactive giants, and a discussion of how magnetic activity shapes the evolution of RS CVn systems. Section 4 summarises our key results and conclusions.
2. Stellar sample and analysis
We used the same instruments for the observations and the analysis method as in Paper I. Here, we present key details, including sample selection and our method for determining lithium abundances.
2.1. Sample selection
We selected most of the sample from Strassmeier (1994), including the stars *iot Gem, *bet Gem, *g Gem, HD 71028, V* FI Cnc, *10 LMi, V* FG UMa, *tau Leo, *93 Leo, *c Vir, V* IT Com, *7 Boo, *eta Boo, V* FR Boo, HD 141690, HD 161832, HD 179094, *f Aql, V* V1971 Cyg, and *alf Sge. We selected the stars *33 Psc, V*V1149 Ori, *sig Gem, V* BM CVn, V* HK Boo, V* V835 Her, V* V2075 Cyg, V* IM Peg, *lam And, and *eps Umi from Eker et al. (2008). The star V*OP And was included from Strassmeier et al. (1990), and the star HD 6497 was taken from Massarotti et al. (2008). We chose these stars based on a variety of criteria, including brightness, positional coordinates, and the allocated observation time. In the case of spectroscopic binaries, only single-lined stars were selected.
2.2. Observations
The stellar observations were carried out from 2021 to 2024 using the 1.65 m Ritchey–Chrétien telescope at Vilnius University’s Moletai Astronomical Observatory. We acquired high-resolution spectra with the Vilnius University Echelle Spectrograph (VUES) (Jurgenson et al. 2016), covering a spectral range from 4000 to 8800 Å. We used spectral resolutions of R ∼ 36 000 and R ∼ 68 000. The stars were exposed for 1200 to 3600 s depending on brightness, resulting in signal-to-noise ratios (S/N) ranging from 57 to 292, with a median S/N of approximately 136. Data reductions were performed using the automated pipeline developed specifically for the VUES spectrograph by Jurgenson et al. (2016).
We obtained a total of 41 observations in two spectroscopic modes for 32 objects: 17 stars were observed at R ∼ 36 000, six at R ∼ 68 000, and the remaining nine in both configurations. Details of the spectral resolution used are presented along with the results. As the lithium abundance was not determined for stars investigated in Paper I, we used the archival spectra to derive lithium abundances, successfully determining them for 13 stars.
2.3. Atmospheric parameters
To determine stellar atmospheric parameters, we considered the effective temperature (Teff), surface gravity (log g), microturbulent velocity (vt), and overall metallicity. We used the DAOSPEC code (Stetson & Pancino 2008) to extract equivalent widths for Fe I and Fe II lines. The MOOG code (Sneden 1973) was used for the iterative adjustment of Teff, log g, vt, and [Fe/H] until there was no slope for [El/H] versus excitation potential or [El/H] versus equivalent width for both Fe I and Fe II lines. On average, 58 Fe I and six Fe II lines were used for the analysis. Atomic lines were selected from the Gaia-ESO line list of Heiter et al. (2015). The model atmospheres were taken from the Model Atmospheres with a Radiative and Convective Scheme (MARCS) stellar model atmosphere and flux library (Gustafsson et al. 2008), and we adopted the solar abundances of Grevesse et al. (2007).
2.4. Elemental abundances and carbon isotope ratios
We derived the abundances of Li, C, N, O, and Mg by spectral synthesis with the TURBOSPECTRUM code (Plez 2012). Figure 1 illustrates examples of fits of the spectral syntheses to several spectral features. We determined lithium abundances from the 6708 Å line and applied non–local thermodynamic equilibrium (NLTE) corrections using the INSPECT database (Lind et al. 2009)2. Fig. 2 shows a comparison of NLTE and local thermodynamic equilibrium (LTE) lithium abundances. For stars with lithium abundances below 2 dex, the corrections are positive and reach about 0.3 dex, while for stars with higher lithium abundances, the corrections become negative.
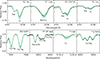 |
Fig. 1. Examples of synthetic spectrum fits to the Li I line, C2 band heads at 5135 Å, and the CN bands at 7995 Å and 8003 Å. Black dots represent the observed spectra, while solid green lines depict the best-fit synthetic spectra. The shaded region around the fit indicates the ±0.10 dex abundance range. |
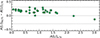 |
Fig. 2. Comparisof NLTE vs LTE lithium abundances. |
We measured oxygen abundances from the forbidden [O I] line at 6300.3 Å. and we obtained carbon abundances from the C2 molecular bands at 5135 Å and 5635 Å. Nitrogen abundances were determined using 12C14N lines in the 6470–6490 Å and 7980–8005 Å regions. We used the 7990–8010 Å interval, containing 13C14N features, to derive the carbon isotope ratio. We performed several iterative steps to calculate the abundances of carbon and oxygen, which are linked by molecular equilibrium. We then fixed the final C and O values to derive N abundances and the 12C/13C ratio. A comprehensive description of the methodology and procedures is available in the Gaia-ESO paper by Tautvaišienė et al. (2015). Although the NLTE effects on the C2 Swan bands remain poorly characterised, they appear negligible, since abundances from the forbidden [C I] line agree with those of C2 (Gustafsson et al. 1999). The [O I] 6300.3 Å line is well modelled under LTE (Asplund 2005).
In V* HK Boo, HD 141690, V* V835 Her, V* V1971 Cyg, and *eps UMi, the [O I] spectral lines were contaminated by telluric interference, which affected the direct determination of the oxygen abundance. We therefore accepted magnesium abundances determined from Mg I lines at 5528.41 Å, 5711.07 Å, 6318.71 Å, and 6319.24 Å as an alternative indicator of the oxygen abundance in these stars.
2.5. Stellar masses
We estimated stellar masses with the UniDAM tool (Mints & Hekker 2017, 2018), which combines Bayesian inference with PAdova and TRieste Stellar Evolution Code (PARSEC) isochrones (Bressan et al. 2012). Our input included spectroscopic atmospheric parameters and near-IR photometry (J, H, and K colours from 2MASS, and W1 and W2 colours from AllWISE). When assigning the stellar mass values, we took into account the quality flags from Sect. 6.1. of Mints & Hekker (2017, 2018).
2.6. Kinematics properties
We used the Python package galpy3 (Bovy 2015) to compute Galactic velocities (U, V, W) based on distances from Bailer-Jones et al. (2021), proper motions, coordinates, and radial velocities from Gaia DR3 (Brown 2021). A Toomre diagram (Fig. 3) separates thin-disc (|Vtot|< 50 km s−1) from thick-disc (|Vtot|> 50 km s−1) stars following Yoshii (1982), Gilmore & Reid (1983), and Recio-Blanco et al. (2014). By combining kinematic parameters and chemical abundances, we classify only *eta Boo as a thick-disc member, while all other targets reside in the thin disc.
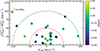 |
Fig. 3. Smple stars colour-coded by metallicity on a Toomre diagram. Dashed lines indicate constant total space velocity. The star *eta Boo, attributed to the thick disc, is marked with a star symbol. |
2.7. Estimation of uncertainties
In the present study, we systematically identified and quantified sources of uncertainty at every stage of our analysis, distinguishing between systematic and random components. Systematic errors were mainly due to uncertainties in the atomic data. We reduced these uncertainties by comparing our results directly with the Sun. Random uncertainties mainly arose from the placement of the local continuum and the fitting of each spectral line. To ensure robust atmospheric parameters, we chose an optimal set of Fe I and Fe II lines that avoid blends, telluric lines, and challenging continuum zones. The mean values of the uncertainties in the full stellar sample are σTeff = 55 K, σlog g = 0.16 dex, σ[Fe/H] = 0.09 dex, and σvt = 0.21 km s−1. The precision of elemental abundances is influenced by uncertainties in atmospheric parameters. To quantify these effects, we varied each atmospheric parameter in isolation, keeping the rest constant, and determined the resulting abundance deviations. The uncertainties derived for HD 179094 are presented in Table 1. We estimated random uncertainties from the line-to-line scatter in the abundances of nitrogen and magnesium. We evaluated the probable uncertainties for oxygen, the carbon isotope ratio, and, in the case of carbon, when only one line was measured, from continuum placement variations according tothe S/N.
Effect of uncertainties in atmospheric parameters on the derived chemical abundances for the star HD 179094.
Our analysis of molecular equilibrium effects on C, N, and O shows that Δ[O/H] = 0.10 drives a change of Δ[C/H] = 0.05, and Δ[N/H] = 0.02; Δ[C/H] = 0.10 induces a change of Δ[N/H] = 0.07, and Δ[O/H] = 0.04; while Δ[N/H] = 0.10 leads to Δ[C/H] = 0.03, and Δ[O/H] = 0.01.
We used the UniDAM tool (Mints & Hekker 2017, 2018) to compute uncertainties in stellar mass and age. The uncertainty values are provided together with the results in the machine-readable Table A.1.
3. Results and discussion
3.1. Stellar parameters
We conducted a systematic investigation of stellar objects spanning a range of post–main-sequence evolutionary stages.
In the machine-readable Tables A.1 and A.2, we provide all parameters determined in this study. The main atmospheric parameters of stars determined in this work are also provided in Table B.1 for convenience. In all plots, we present the averaged values of parameters determined from spectra observed in the two spectral resolutions (R = 36 000 and R = 68 000), where available.
The effective temperatures (Teff) of these stars lie between 4120 and 6220 K, the surface gravities (log g) range from 1.4 to 4.3 dex, and the metallicity ([Fe/H]) values span from −0.85 to 0.34 dex, with an average of −0.26 dex. Stellar ages cover a wide interval from 380 Myr to 10.5 Gyr; consequently the stellar masses range from 3.5 M⊙ down to 0.9 M⊙. Taken together, these quantities demonstrate that the RS CVn stars in our sample form a heterogeneous group of giants at different stages of their post-main-sequence evolution.
We compared our atmospheric parameters (Teff, log g, and [Fe/H]) with existing data from the literature (Fig. 4). The comparison is made with spectroscopic studies by Tautvaišienė et al. (2022), García Pérez et al. (2021), Gonçalves et al. (2020), Feuillet et al. (2016), Boeche & Grebel (2016), Adamczak & Lambert (2014), Tautvaišienė et al. (2010), Guillout et al. (2009), Massarotti et al. (2008), Luck & Heiter (2007), Mallik (1998). The agreement in effective temperatures and surface gravities is good, whereas the scatter in metallicities is larger.
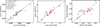 |
Fig. 4. Atmospheric parameters derived in this study (Teff, left; log g, middle; and [Fe/H], right) compared with values from studies listed in Sect. 3.1. |
The lithium abundances, carbon isotope 12C/13C ratios, and C/N ratios determined for 32 stars are presented in Table 2. In Table 3, the lithium abundances are presented for 13 stars investigated using archival spectra. For these stars, the 12C/13C and C/N ratios determined in Paper I are also presented for convenience. In addition, we present stellar masses and evolutionary stages. We determined the evolutionary stages by inspecting the positions of stars in the log g versus Teff diagram, using the PARSEC evolutionary tracks (Bressan et al. 2012), and taking into account their carbon and nitrogen abundances. For stars with masses lower than 2.2 M⊙, the RGB luminosity bump, where the extra-mixing begins, is visible in the stellar evolutionary sequences as a zigzag. Stars with larger masses do not experience extra-mixing during the first ascent on the RGB, and the so-called second dredge-up only begins on the asymptotic giant branch, unless rotation-induced mixing occurs (Charbonnel & Lagarde 2010). Fig. 5 shows the positions of two stars. We discuss these stars in Sect. 3.2.
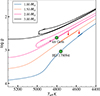 |
Fig. 5. Log g versus Teff diagram. Locations of *iot Gem (1.37 M⊙) and HD 179094 (1.03 M⊙) below the RGB luminosity bump are denoted by red arrows, on the PARSEC evolutionary tracks for solar metallicity from Bressan et al. (2012). |
Mass, 12C/13C, C/N, NLTE lithium abundances, and evolutionary stage.
In our sample of 32 stars, three are subgiants (we mark them as SG), 18 stars are below the RGB luminosity bump (we mark them as BB) and eight above (marked as AB). Two stars are attributed to the core He-burning red clump (marked as RC).
3.2. CNO abundances and carbon isotope ratios
The determination of the surface abundances of carbon and nitrogen in RS CVn stars offers a direct probe of how efficiently material is mixed within their convective envelopes under the combined influence of rotation and tidal forces. In canonical stellar models, the 1DUP brings the processed material from the CN-cycle to the envelope, where 12C is depleted, whereas 13C and 14N become enhanced (Iben 1965; Charbonnel & Zahn 2007). Surface compositions undergo additional changes when extra-mixing begins at the RGB luminosity bump in low-mass stars. The extent of the resulting change in 12C/13C and C/N ratios depends on the evolutionary status of a star, its mass, and its metallicity (Gilroy 1989; Luck 1994; Tautvaišienė et al. 2005, 2010; Smiljanic et al. 2009; Mikolaitis et al. 2010, 2011a,b).
Figure 6 presents the element-to-iron abundance ratios [El/Fe] as a function of [Fe/H], along with the results of Paper I and those for RGB thin-disc stars from Tautvaišienė et al. (2022), which were determined using spectra from the same telescope and analysis method, for comparison. For magnesium, the predicted Galactic evolution trend from Pagel & Tautvaisiene (1995) is also shown. The investigated RS CVn stars at various evolutionary stages are plotted using different symbols. The giants below the RGB luminosity bump are shown as filled blue circles, the giants above it as filled red circles, the red clump stars as red triangles, and the thin-disc subgiants as blue crosses. The thick-disc subgiant star *eta Boo, attributed to this population according to its location in the Toomre diagram (Fig. 3), is shown as the green plus sign.
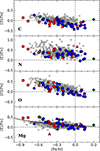 |
Fig. 6. Element-to-iron abundance ratios from this work and Paper I as a function of [Fe/H]. Circles represent red giant branch (RGB) stars, plus signs indicate subgiant stars, and the triangles denote red clump stars. Blue symbols correspond to stars at the evolutionary stage below the RGB luminosity bump, while red symbols indicate stars above the bump. Green symbols mark stars of the thick disc. The solid line represents the Galactic chemical evolution model for the thin disc by Pagel & Tautvaisiene (1995). Grey plus signs represent [El/Fe] abundances of thin-disc RGB stars from Tautvaišienė et al. (2022) for comparison. |
The chromospherically active RS CVn stars examined in this study do not exhibit systematic deviations in oxygen and magnesium abundances compared to inactive RGB stars or to the Galactic model (Pagel & Tautvaisiene 1995). The carbon abundances appear slightly more depleted, but the enhancement of the nitrogen abundance is not obvious across the sampled metallicity range. The thin-disc subgiants have slightly higher C and lower N abundances, as expected. The thick-disc subgiant shows slightly larger abundances of C and α-elements, as expected.
Carbon isotope and C/N ratios are sensitive probes of nuclear burning and mixing inside stars and are often used to trace evolutionary abundance changes. Fig. 7 compares the 12C/13C and C/N ratios of the investigated RS CVn stars with several recent theoretical predictions. These include the 1DUP and thermohaline-induced extra-mixing (TH) models from Lagarde et al. (2017), as well as the models that incorporate both thermohaline- and rotation-induced mixing (TH+ROT) in addition to the 1DUP, as presented by Charbonnel et al. (2017), all for solar-metallicity stars.
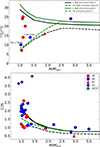 |
Fig. 7. Comparison of 12C/13C and C/N ratios with theoretical models. Solid green and black lines correspond to first dredge-up (1 DUP) models from Lagarde et al. (2012) and Charbonnel et al. (2017), respectively. The green dashed line represents the minimal values in the model with thermohaline-induced extra-mixing (TH) from Lagarde et al. (2017), while the dashed black line shows minimal values in the model with thermohaline- and rotation-induced extra-mixing (TH+ROT) from Charbonnel et al. (2017). Symbols are the same as in Fig. 6. |
In Fig. 7, stars located above the RGB luminosity bump (red circles) and clump stars (red triangles) show evidence of extra-mixing, as expected. However, one star (V* OP And) belongs to the post-RGB luminosity bump stars, but has a relatively large C/N ratio of 2.60, the highest red circle in the C/N versus mass plot. Its carbon isotope ratio is not greatly reduced, with a value of 24. This K1 III spectral-type giant also shows a very high lithium abundance and is classified as a Li-rich star in this paper and, for example, in Balachandran et al. (2000) and Gonçalves et al. (2020). Since the first Li-rich K giant star was discovered by Wallerstein & Sneden (1982), a complete explanation of this phenomenon has remained unknown. Thermohaline- or rotation-induced mixing, which predicts lithium production via the Cameron-Fowler mechanism (Cameron & Fowler 1971), is unlikely to apply to V* OP And, since it should also bring CN-cycled material to the surface, lowering the C/N and 12C/13C ratios. Lithium enrichment via mass transfer from a companion is unlikely, as no observations indicate that V* OP And is a binary. Another explanation for lithium enhancement, such as planet engulfment, could be tested by investigating whether all lithium isotopes are elevated. Therefore, the origin of V* OP And as an Li-rich star remains to be investigated.
Stars located below the RGB luminosity bump (blue circles) follow the predictions of the 1DUP model, as expected. However, *iot Gem and HD 179094, both situated below the RGB luminosity bump (see Fig. 5), exhibit lower 12C/13C ratios than predicted by the 1DUP models (cf. Lagarde et al. 2017; Charbonnel et al. 2017). These stars show carbon isotope ratios typical of stars that have already undergone extra-mixing, which generally begins at the RGB luminosity bump. Specifically, *iot Gem and HD 179094 have 12C/13C values of approximately 14 and 10, respectively, consistent with the thermohaline-induced mixing model. Rotation-induced mixing has little influence on stars at these masses. As in Paper I, we searched our sample stars for emission in the Ca II lines at 8498, 8542, and 8662 Å. Emission is detected in HD 179094. Information on emissions in the Ca II lines in the spectra of other sample stars is provided in Table A.1.
In our sample of RS CVn stars, we identified two additional stars (*iot Gem and HD 179094) that are below the RGB luminosity bump and with 12C/13C ratios significantly lower than the 1DUP values. This increases the number of identified RS CVn stars identified as exhibiting extra-mixing that begins earlier than in normal giants. Previously identified examples include *29 Dra, *b01 Cyg, V* V834 Her Paper I, and λ And (Tautvaišienė et al. 2010; Drake et al. 2011). The star *29 Dra was also investigated by Barisevičius et al. (2010). Thus, 12C/13C ratios in about 10% of the investigated RS CVn stars indicate the onset of extra-mixing before the RGB luminosity bump. Finally, the C/N ratios in the investigated subgiant stars are higher, as expected for stars before the 1DUP (Grevesse et al. 2007; Asplund et al. 2009).
3.3. Lithium abundances
Lithium abundances are more sensitive to stellar evolution than those of carbon and nitrogen. Low- and intermediate-mass giants, having extended convective envelopes, are of particular interest in studies of lithium abundance evolution. Numerous observational and theoretical studies have been conducted. Most recent large spectroscopic surveys have investigated lithium abundances in large stellar samples (e.g. GALAH, Deepak & Reddy 2020; Wang et al. 2024), Gaia-ESO (Magrini et al. 2021b; Franciosini et al. 2022), and LAMOST (Zhou et al. 2022; Ding et al. 2024).
The peak of RS CVn star investigations occurred about 30 years ago, when several groups attempted to determine whether there is any relationship between lithium abundance and stellar magnetic activity (Pallavicini et al. 1990, 1992; Fekel & Balachandran 1993; Liu et al. 1993; Randich et al. 1993, 1994). An overview of lithium abundance investigations from that period is provided by Pallavicini et al. (1994). At present, with large samples of RGB stars available for comparison, NLTE lithium abundance determinations, and more sophisticated theoretical models of lithium abundance evolution, more comprehensive studies are possible.
Lagarde et al. (2012) presented a grid of stellar evolutionary models for four metallicities (Z = 0.0001, 0.002, 0.004, and 0.014) in the mass range 0.85–6.0 M⊙. The models were computed with standard prescriptions or with both thermohaline convection and rotation-induced mixing acting together. The initial rotation velocity of these models on the zero-age main sequence (ZAMS) was set at 45% of the critical velocity at the corresponding point. The ratio of Vini/Vcrit = 0.45 agrees closely with the mean value of the observed velocity distribution for low- and intermediate-mass stars in young open clusters. This initial rotation rate leads to mean velocities in the main sequence of between 90 and 137 km s−1.
Fig. 8 plots the NLTE lithium abundance against surface gravity (log g) for our full sample of stars (Tables 2 and 3), together with models from Lagarde et al. (2012) at three metallicities (Z = 0.014, Z = 0.004, Z = 0.002). We divided the stars in our sample by mass and plotted models with several metallicities where necessary. About half of the low-mass stars in our sample, for which the lithium abundances were determined, fall close to the predicted post–1DUP plateau. However, other stars, including those where extra-mixing appears to begin earlier, have lower lithium abundances. The intermediate-mass stars have lithium abundances reduced by rotation-induced mixing. In addition, the lithium lines were too weak for reliable abundance determinations in 18 stars.
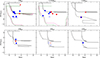 |
Fig. 8. NLTE lithium abundance as a function of log g for stars with different masses. The lines represent models for stars evolving from the subgiant branch to the RGB tip; solid lines show the 1DUP, the dashed lines represent the models with thermohaline- and rotation-induced mixing from Lagarde et al. (2012). Black lines correspond to Z = 0.014, pink lines to Z = 0.004, and green lines to Z = 0.002. Symbol meanings are the same as in Fig. 6. Unfilled symbols represent upper lithium abundance limits. The Li-rich star is marked with a red star symbol. |
NLTE lithium abundances alongside results from Paper I.
Because Lagarde et al. (2012) did not provide a model with purely thermohaline-induced extra-mixing, we compared our data with the models of Charbonnel & Lagarde (2010), who studied the effects of thermohaline instability and rotation-induced mixing in the 1–4 M⊙ mass range at solar metallicity. Fig. 9 compares the NLTE lithium abundances of our sample stars with these models. This comparison shows that extra-mixing in low-mass stars does not exceed pure thermohaline-induced mixing, and confirms that the extra-mixing of lithium in intermediate-mass stars is driven by rotation-inducedmixing.
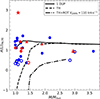 |
Fig. 9. NLTE lithium abundance versus mass. Symbols are the same as in Fig. 8. Unfilled symbols denote upper limits. Theoretical models are from Charbonnel & Lagarde (2010), computed for solar metallicity and mass stars. The solid black line represents lithium abundances predicted at the 1DUP (1 DUP), the dashed line corresponds to thermohaline-induced mixing (TH), and the dot-dashed line indicates minimal values in the model with thermohaline- and rotation-induced extra-mixing (TH+ROT) with the rotation on Zero Age Main Sequence (ZAMS) equal to approximately 110 km s−1. |
In Fig. 10, we also compare the lithium abundances of our sample stars with the data from Magrini et al. (2021b). We selected this study because, as in our work, the investigated giants were divided according to their evolutionary stage (lower RGB, upper RGB, and red clump stars). Because LTE lithium abundances were presented in their work, we compared them with LTE lithium abundances determined in our study. The comparison shows that the RS CVn stars follow the overall decline of lithium with evolution driven by 1DUP and extra-mixing, and that among the lower RGB stars there are RS CVn stars with lithium depletion caused by extra-mixing or rotation, depending on their mass.
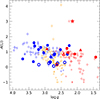 |
Fig. 10. Comparison of LTE lithium abundances as a function of log g with results from Magrini et al. (2021b). Symbols are the same as in Fig. 8. Plus signs indicate the LTE lithium abundances from (Magrini et al. 2021b). The smaller plus signs denote upper limits. Blue symbols mark lower RGB stars, red symbols indicate upper RGB stars, and yellow symbols represents clump stars. |
The lithium abundances in several investigated RS CVn subgiants are also reduced, lying between 2.24 and 0.74 dex. However, these values fall in the same region as normal subgiants with similar atmospheric parameters (see, e.g. Fig. 15 in Franciosini et al. 2022).
Finally, Fig. 11 compares the determined lithium abundances with carbon isotope ratios to test for the presence of a relation. The sample of stars with both A(Li) and 12C/13C ratios determined is rather small. The dashed line represents a linear, statistically insignificant positive relation for the first-ascent giants, with a Pearson’s correlation coefficient PCC = 0.48 and a probability value p = 0.16. However, this plot highlights the red clump star *37 Com, which has a low 12C/13C of 7 and a relatively high A(Li) = 1.42. This may indicate that the lithium abundance in this star was enhanced near the RGB tip or during the helium flash. This possibility has recently been widely discussed in the literature (Schwab 2020; Mori et al. 2021; Mallick et al. 2025; Li et al. 2025, and references therein).
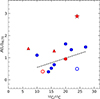 |
Fig. 11. NLTE lithium abundance as a function of 12C/13C. Symbols are the same as in Fig. 8. The dashed line represents a linear, statistically insignificant fit to first-ascent giants, with a PCC of 0.48. |
4. Summary and conclusions
In this study, we continue the investigation of chromospherically active RS CVn stars. In Paper I, we investigated 20 RS CVn stars with an emphasis on determining CNO abundances and carbon isotope ratios. Here, we observe 32 RS CVn stars at high spectral resolution with the 1.65 m telescope of the Moletai Astronomical Observatory and the UVES spectrograph to derive their atmospheric parameters and Li, 12C, 13C, N, O, and Mg abundances. Lithium abundances were also determined using archival spectra for 13 RS CVn stars investigated in Paper I.
From a total sample of 52 investigated RS CVn stars, we draw the following main conclusions:
-
Among the RS CVn giants, some stars exhibit extra-mixing that begins earlier than in normal giants, as indicated by the lowered 12C/13C ratios in *iot Gem, HD 179094, *29 Dra, *b01 Cyg, and V* V834 Her, which have not reached the evolutionary phase of RGB luminosity bump yet.
-
The Li-rich RS CVn giant V* OP And has relatively high C/N and 12C/13C ratios, raising questions about the origin of its lithium enhancement.
-
About half of the low-mass giants, for which we determined the lithium abundances, follow the first dredge-up (1DUP) predictions. However, other stars, including those where extra-mixing begins earlier, have lithium abundances reduced by thermohaline-induced mixing. The intermediate-mass stars show lithium abundances reduced by rotation-induced mixing.
-
The comparison with observations of normal giants shows that RS CVn stars follow the overall decline of lithium with evolution driven by 1DUP and extra-mixing, and that among the lower RGB stars, some RS CVn stars display lithium depletion due to extra-mixing.
Data availability
Full Tables A.1 and A.2 are available at the CDS via https://cdsarc.cds.unistra.fr/viz-bin/cat/J/A+A/703/A128
 .
.
Acknowledgments
We acknowledge funding from the Research Council of Lithuania (LMTLT, grant No. S-MIP-23-24). This work has made use of data from the European Space Agency (ESA) mission Gaia (https://www.cosmos.esa.int/gaia), processed by the Gaia Data Processing and Analysis Consortium (DPAC, https://www.cosmos.esa.int/web/gaia/dpac/consortium). Funding for the DPAC has been provided by national institutions, in particular, the institutions participating in the Gaia Multilateral Agreement. We have made extensive use of the NASA ADS and SIMBAD databases.
References
- Adamczak, J., & Lambert, D. L. 2014, ApJ, 791, 58 [NASA ADS] [CrossRef] [Google Scholar]
- Adamów, M., Niedzielski, A., Villaver, E., Nowak, G., & Wolszczan, A. 2012, ApJ, 754, L15 [Google Scholar]
- Asplund, M. 2005, ARA&A, 43, 481 [Google Scholar]
- Asplund, M., Grevesse, N., Sauval, A. J., & Scott, P. 2009, ARA&A, 47, 481 [NASA ADS] [CrossRef] [Google Scholar]
- Bailer-Jones, C. A. L., Rybizki, J., Fouesneau, M., Demleitner, M., & Andrae, R. 2021, AJ, 161, 147 [Google Scholar]
- Balachandran, S. C., Fekel, F. C., Henry, G. W., & Uitenbroek, H. 2000, ApJ, 542, 978 [NASA ADS] [CrossRef] [Google Scholar]
- Bale, B., Tautvaišienė, G., Minkevičiūtė, R., et al. 2025, A&A, 696, A23 [NASA ADS] [CrossRef] [EDP Sciences] [Google Scholar]
- Barisevičius, G., Tautvaišienė, G., Berdyugina, S., Chorniy, Y., & Ilyin, I. 2010, Baltic Astron., 19, 157 [Google Scholar]
- Boeche, C., & Grebel, E. K. 2016, A&A, 587, A2 [NASA ADS] [CrossRef] [EDP Sciences] [Google Scholar]
- Bovy, J. 2015, ApJS, 216, 29 [NASA ADS] [CrossRef] [Google Scholar]
- Bressan, A., Marigo, P., Girardi, L., et al. 2012, MNRAS, 427, 127 [NASA ADS] [CrossRef] [Google Scholar]
- Busso, M., Wasserburg, G. J., Nollett, K. M., & Calandra, A. 2007, ApJ, 671, 802 [NASA ADS] [CrossRef] [Google Scholar]
- Cameron, A. G. W., & Fowler, W. A. 1971, ApJ, 164, 111 [NASA ADS] [CrossRef] [Google Scholar]
- Cantiello, M., & Langer, N. 2010, A&A, 521, A9 [NASA ADS] [CrossRef] [EDP Sciences] [Google Scholar]
- Cao, D., & Gu, S. 2025, AJ, 169, 198 [Google Scholar]
- Cao, D., Gu, S., Wolter, U., et al. 2023, MNRAS, 523, 4146 [NASA ADS] [CrossRef] [Google Scholar]
- Casey, A. R., Ho, A. Y. Q., Ness, M., et al. 2019, ApJ, 880, 125 [Google Scholar]
- Chanamé, J., Pinsonneault, M., & Terndrup, D. M. 2005, ApJ, 631, 540 [Google Scholar]
- Charbonnel, C., & Zahn, J. P. 2007, A&A, 476, L29 [NASA ADS] [CrossRef] [EDP Sciences] [Google Scholar]
- Charbonnel, C., & Lagarde, N. 2010, A&A, 522, A10 [CrossRef] [EDP Sciences] [Google Scholar]
- Charbonnel, C., Decressin, T., Lagarde, N., et al. 2017, A&A, 605, A102 [NASA ADS] [CrossRef] [EDP Sciences] [Google Scholar]
- Charbonnel, C., Lagarde, N., Jasniewicz, G., et al. 2020, A&A, 633, A34 [NASA ADS] [CrossRef] [EDP Sciences] [Google Scholar]
- Cyburt, R. H., Fields, B. D., & Olive, K. A. 2008, JCAP, 2008, 012 [Google Scholar]
- Deepak, L., & Reddy, B. E. 2020, MNRAS, 494, 1348 [Google Scholar]
- Denissenkov, P. A., & Herwig, F. 2004, ApJ, 612, 1081 [NASA ADS] [CrossRef] [Google Scholar]
- Ding, M.-Y., Shi, J.-R., Yan, H.-L., et al. 2024, ApJS, 271, 58 [Google Scholar]
- Drake, J. J., Ball, B., Eldridge, J. J., Ness, J. U., & Stancliffe, R. J. 2011, AJ, 142, 144 [NASA ADS] [CrossRef] [Google Scholar]
- Eggleton, P. P., Dearborn, D. S. P., & Lattanzio, J. C. 2006, Science, 314, 1580 [Google Scholar]
- Eggleton, P. P., Dearborn, D. S. P., & Lattanzio, J. C. 2008, ApJ, 677, 581 [NASA ADS] [CrossRef] [Google Scholar]
- Eker, Z., Ak, N. F., Bilir, S., et al. 2008, MNRAS, 389, 1722 [NASA ADS] [CrossRef] [Google Scholar]
- Fekel, F. C., & Balachandran, S. 1993, ApJ, 403, 708 [NASA ADS] [CrossRef] [Google Scholar]
- Fekel, F. C., Moffett, T. J., & Henry, G. W. 1986, ApJS, 60, 551 [NASA ADS] [CrossRef] [Google Scholar]
- Feuillet, D. K., Bovy, J., Holtzman, J., et al. 2016, ApJ, 817, 40 [NASA ADS] [CrossRef] [Google Scholar]
- Franciosini, E., Randich, S., de Laverny, P., et al. 2022, A&A, 668, A49 [NASA ADS] [CrossRef] [EDP Sciences] [Google Scholar]
- Gaia Collaboration (Brown, A. G. A., et al.) 2021, A&A, 649, A1 [NASA ADS] [CrossRef] [EDP Sciences] [Google Scholar]
- Gao, Q., Shi, J.-R., Yan, H.-L., et al. 2019, ApJS, 245, 33 [NASA ADS] [CrossRef] [Google Scholar]
- García Pérez, A. E., Sánchez-Blázquez, P., Vazdekis, A., et al. 2021, MNRAS, 505, 4496 [CrossRef] [Google Scholar]
- Gilmore, G., & Reid, N. 1983, MNRAS, 202, 1025 [Google Scholar]
- Gilroy, K. K. 1989, ApJ, 347, 835 [CrossRef] [Google Scholar]
- Gonçalves, B. F. O., da Costa, J. S., de Almeida, L., Castro, M., & do Nascimento, Jr., J. D. 2020, MNRAS, 498, 2295 [CrossRef] [Google Scholar]
- Grevesse, N., Asplund, M., & Sauval, A. J. 2007, Space Sci. Rev., 130, 105 [Google Scholar]
- Guandalini, R., Palmerini, S., Busso, M., & Uttenthaler, S. 2009, PASA, 26, 168 [NASA ADS] [Google Scholar]
- Guillout, P., Klutsch, A., Frasca, A., et al. 2009, A&A, 504, 829 [NASA ADS] [CrossRef] [EDP Sciences] [Google Scholar]
- Gustafsson, B., Karlsson, T., Olsson, E., Edvardsson, B., & Ryde, N. 1999, A&A, 342, 426 [NASA ADS] [Google Scholar]
- Gustafsson, B., Edvardsson, B., Eriksson, K., et al. 2008, A&A, 486, 951 [NASA ADS] [CrossRef] [EDP Sciences] [Google Scholar]
- Hall, D. S. 1976, in IAU Colloq. 29: Multiple Periodic Variable Stars, ed. W. S. Fitch, Astrophysics and Space Science Library, 60, 287 [NASA ADS] [CrossRef] [Google Scholar]
- Heiter, U., Lind, K., Asplund, M., et al. 2015, Phys. Scr., 90, 054010 [Google Scholar]
- Herbig, G. H. 1965, ApJ, 141, 588 [NASA ADS] [CrossRef] [Google Scholar]
- Iben, I., Jr 1965, ApJ, 142, 1447 [NASA ADS] [CrossRef] [Google Scholar]
- Iben, I., Jr 1968, ApJ, 154, 581 [NASA ADS] [CrossRef] [Google Scholar]
- Israelian, G., Santos, N. C., Mayor, M., & Rebolo, R. 2004, A&A, 414, 601 [NASA ADS] [CrossRef] [EDP Sciences] [Google Scholar]
- Izzo, L., Della Valle, M., Mason, E., et al. 2015, ApJ, 808, L14 [NASA ADS] [CrossRef] [Google Scholar]
- Jurgenson, C., Fischer, D., McCracken, T., et al. 2016, J. Astron. Instrum., 5, 1650003 [Google Scholar]
- King, J. R., Deliyannis, C. P., Hiltgen, D. D., et al. 1997, AJ, 113, 1871 [Google Scholar]
- Kumar, Y. B., Reddy, B. E., Campbell, S. W., et al. 2020, Nat. Astron., 4, 1059 [NASA ADS] [CrossRef] [Google Scholar]
- Lagarde, N., Decressin, T., Charbonnel, C., et al. 2012, A&A, 543, A108 [NASA ADS] [CrossRef] [EDP Sciences] [Google Scholar]
- Lagarde, N., Robin, A. C., Reylé, C., & Nasello, G. 2017, A&A, 601, A27 [NASA ADS] [CrossRef] [EDP Sciences] [Google Scholar]
- Li, X.-F., Shi, J.-R., Li, Y., Yan, H.-L., & Zhang, J.-H. 2025, ApJ, 982, L4 [Google Scholar]
- Lind, K., Asplund, M., & Barklem, P. S. 2009, A&A, 503, 541 [NASA ADS] [CrossRef] [EDP Sciences] [Google Scholar]
- Liu, X.-F., Zhao, G., Tan, H.-S., & Lu, F.-J. 1993, Chin. Astron. Astrophys., 17, 51 [Google Scholar]
- Luck, R. E. 1994, ApJS, 91, 309 [NASA ADS] [CrossRef] [Google Scholar]
- Luck, R. E., & Heiter, U. 2007, AJ, 133, 2464 [Google Scholar]
- Lyubimkov, L. S. 2016, Astrophysics, 59, 411 [NASA ADS] [CrossRef] [Google Scholar]
- Magrini, L., Lagarde, N., Charbonnel, C., et al. 2021a, A&A, 651, A84 [NASA ADS] [CrossRef] [EDP Sciences] [Google Scholar]
- Magrini, L., Smiljanic, R., Franciosini, E., et al. 2021b, A&A, 655, A23 [NASA ADS] [CrossRef] [EDP Sciences] [Google Scholar]
- Mallick, A., Singh, R., & Reddy, B. E. 2023, ApJ, 944, L5 [NASA ADS] [CrossRef] [Google Scholar]
- Mallick, A., Sneden, C., Reddy, B. E., & Afşar, M. 2025, ApJ, 980, 265 [Google Scholar]
- Mallik, S. V. 1998, A&A, 338, 623 [NASA ADS] [Google Scholar]
- Martell, S. L., Simpson, J. D., Balasubramaniam, A. G., et al. 2021, MNRAS, 505, 5340 [NASA ADS] [Google Scholar]
- Massarotti, A., Latham, D. W., Stefanik, R. P., & Fogel, J. 2008, AJ, 135, 209 [Google Scholar]
- Mikolaitis, Š., Tautvaišienė, G., Gratton, R., Bragaglia, A., & Carretta, E. 2010, MNRAS, 407, 1866 [NASA ADS] [CrossRef] [Google Scholar]
- Mikolaitis, Š., Tautvaišienė, G., Gratton, R., Bragaglia, A., & Carretta, E. 2011a, MNRAS, 413, 2199 [NASA ADS] [CrossRef] [Google Scholar]
- Mikolaitis, Š., Tautvaišienė, G., Gratton, R., Bragaglia, A., & Carretta, E. 2011b, MNRAS, 416, 1092 [NASA ADS] [CrossRef] [Google Scholar]
- Mints, A., & Hekker, S. 2017, A&A, 604, A108 [NASA ADS] [CrossRef] [EDP Sciences] [Google Scholar]
- Mints, A., & Hekker, S. 2018, A&A, 618, A54 [NASA ADS] [CrossRef] [EDP Sciences] [Google Scholar]
- Molaro, P., Izzo, L., Mason, E., Bonifacio, P., & Della Valle, M. 2016, MNRAS, 463, L117 [NASA ADS] [CrossRef] [Google Scholar]
- Mori, K., Kusakabe, M., Balantekin, A. B., Kajino, T., & Famiano, M. A. 2021, MNRAS, 503, 2746 [NASA ADS] [CrossRef] [Google Scholar]
- Mucciarelli, A., Monaco, L., Bonifacio, P., et al. 2022, A&A, 661, A153 [NASA ADS] [CrossRef] [EDP Sciences] [Google Scholar]
- Nordhaus, J., Busso, M., Wasserburg, G. J., Blackman, E. G., & Palmerini, S. 2008, ApJ, 684, L29 [NASA ADS] [CrossRef] [Google Scholar]
- Norris, J. E., Yong, D., Frebel, A., & Ryan, S. G. 2023, MNRAS, 522, 1358 [NASA ADS] [CrossRef] [Google Scholar]
- Olive, K. A., & Schramm, D. N. 1992, Nature, 360, 439 [Google Scholar]
- Pagel, B. E. J., & Tautvaisiene, G. 1995, MNRAS, 276, 505 [NASA ADS] [CrossRef] [Google Scholar]
- Palacios, A., Talon, S., Charbonnel, C., & Forestini, M. 2003, A&A, 399, 603 [CrossRef] [EDP Sciences] [Google Scholar]
- Pallavicini, R. 1994, in Cool Stars, Stellar Systems, and the Sun, ed. J. P. Caillault, ASP Conf. Ser., 64, 244 [Google Scholar]
- Pallavicini, R., Randich, S., Giampapa, M., & Cutispoto, G. 1990, The Messenger, 62, 51 [NASA ADS] [Google Scholar]
- Pallavicini, R., Randich, S., & Giampapa, M. S. 1992, A&A, 253, 185 [NASA ADS] [Google Scholar]
- Pinsonneault, M. 1997, ARA&A, 35, 557 [NASA ADS] [CrossRef] [Google Scholar]
- Pitrou, C., Coc, A., Uzan, J.-P., & Vangioni, E. 2018, Phys. Rep., 754, 1 [Google Scholar]
- Plez, B. 2012, Astrophysics Source Code Library [record ascl:1205.004] [Google Scholar]
- Popper, D. M., & Ulrich, R. K. 1977, ApJ, 212, L131 [Google Scholar]
- Randich, S., & Magrini, L. 2021, Front. Astron. Space Sci., 8, 6 [NASA ADS] [CrossRef] [Google Scholar]
- Randich, S., Giampapa, M. S., & Pallavicini, R. 1992, in Cool Stars, Stellar Systems, and the Sun, eds. M. S. Giampapa, & J. A. Bookbinder, ASP Conf. Ser., 26, 576 [Google Scholar]
- Randich, S., Gratton, R., & Pallavicini, R. 1993, A&A, 273, 194 [NASA ADS] [Google Scholar]
- Randich, S., Giampapa, M. S., & Pallavicini, R. 1994, A&A, 283, 893 [NASA ADS] [Google Scholar]
- Recio-Blanco, A., de Laverny, P., Kordopatis, G., et al. 2014, A&A, 567, A5 [NASA ADS] [CrossRef] [EDP Sciences] [Google Scholar]
- Reeves, H., Fowler, W. A., & Hoyle, F. 1970, Nature, 226, 727 [Google Scholar]
- Rucinski, S. M., Krogulec, M., & Seaquist, E. R. 1993, AJ, 105, 2308 [Google Scholar]
- Rukeya, R., Lü, G., Wang, Z., & Zhu, C. 2017, PASP, 129, 074201 [NASA ADS] [CrossRef] [Google Scholar]
- Sackmann, I. J., & Boothroyd, A. I. 1992, ApJ, 392, L71 [NASA ADS] [CrossRef] [Google Scholar]
- Sayeed, M., Ness, M. K., Montet, B. T., et al. 2024, ApJ, 964, 42 [NASA ADS] [CrossRef] [Google Scholar]
- Schwab, J. 2020, ApJ, 901, L18 [NASA ADS] [CrossRef] [Google Scholar]
- Smiljanic, R., Gauderon, R., North, P., et al. 2009, A&A, 502, 267 [NASA ADS] [CrossRef] [EDP Sciences] [Google Scholar]
- Smiljanic, R., Franciosini, E., Bragaglia, A., et al. 2018, A&A, 617, A4 [NASA ADS] [CrossRef] [EDP Sciences] [Google Scholar]
- Sneden, C. A. 1973, PhD thesis, University of Texas, Austin, USA [Google Scholar]
- Soares-Furtado, M., Cantiello, M., MacLeod, M., & Ness, M. K. 2021, AJ, 162, 273 [NASA ADS] [CrossRef] [Google Scholar]
- Soderblom, D. R. 1984, in Cool Stars, Stellar Systems, and the Sun, eds. S. L. Baliunas, & L. Hartmann, 193, 205 [Google Scholar]
- Spite, F., & Spite, M. 1982, A&A, 115, 357 [NASA ADS] [Google Scholar]
- Starrfield, S., Truran, J. W., Sparks, W. M., & Arnould, M. 1978, ApJ, 222, 600 [NASA ADS] [CrossRef] [Google Scholar]
- Stetson, P. B., & Pancino, E. 2008, PASP, 120, 1332 [Google Scholar]
- Strassmeier, K. G. 1994, A&AS, 103, 413 [NASA ADS] [Google Scholar]
- Strassmeier, K. G., Fekel, F. C., Bopp, B. W., Dempsey, R. C., & Henry, G. W. 1990, ApJS, 72, 191 [NASA ADS] [CrossRef] [Google Scholar]
- Tautvaišienė, G., Edvardsson, B., Puzeras, E., & Ilyin, I. 2005, A&A, 431, 933 [NASA ADS] [CrossRef] [EDP Sciences] [Google Scholar]
- Tautvaišienė, G., Barisevičius, G., Berdyugina, S., Chorniy, Y., & Ilyin, I. 2010, Baltic Astron., 19, 95 [NASA ADS] [Google Scholar]
- Tautvaišienė, G., Drazdauskas, A., Mikolaitis, Š., et al. 2015, A&A, 573, A55 [NASA ADS] [CrossRef] [EDP Sciences] [Google Scholar]
- Tautvaišienė, G., Mikolaitis, Š., Drazdauskas, A., et al. 2022, ApJS, 259, 45 [CrossRef] [Google Scholar]
- Toet, S. E. B., Vedantham, H. K., Callingham, J. R., et al. 2021, A&A, 654, A21 [NASA ADS] [CrossRef] [EDP Sciences] [Google Scholar]
- Vigroux, L., & Arnould, M. 1979, in Liege International Astrophysical Colloquia, eds. A. Boury, N. Grevesse, & L. Remy-Battiau, 22, 47 [Google Scholar]
- Villaver, E., & Livio, M. 2009, ApJ, 705, L81 [Google Scholar]
- Wallerstein, G., & Sneden, C. 1982, ApJ, 255, 577 [NASA ADS] [CrossRef] [Google Scholar]
- Walter, F. M., Cash, W., Charles, P. A., & Bowyer, C. S. 1980, ApJ, 236, 212 [Google Scholar]
- Wang, E. X., Nordlander, T., Buder, S., et al. 2024, MNRAS, 528, 5394 [CrossRef] [Google Scholar]
- White, N. E., Sanford, P. W., & Weiler, E. J. 1978, Nature, 274, 569 [Google Scholar]
- Yoshii, Y. 1982, PASJ, 34, 365 [NASA ADS] [Google Scholar]
- Zhou, Y., Wang, C., Yan, H., et al. 2022, ApJ, 931, 136 [NASA ADS] [CrossRef] [Google Scholar]
Appendix A: Machine readable tables of results
Determinations of stellar main parameters and C, N, O, and Mg abundances
Determinations of lithium abundances
Appendix B: Atmospheric parameters of investigated stars
Main atmospheric parameters
All Tables
Effect of uncertainties in atmospheric parameters on the derived chemical abundances for the star HD 179094.
All Figures
|
Fig. 1. Examples of synthetic spectrum fits to the Li I line, C2 band heads at 5135 Å, and the CN bands at 7995 Å and 8003 Å. Black dots represent the observed spectra, while solid green lines depict the best-fit synthetic spectra. The shaded region around the fit indicates the ±0.10 dex abundance range. |
| In the text | |
|
Fig. 2. Comparisof NLTE vs LTE lithium abundances. |
| In the text | |
|
Fig. 3. Smple stars colour-coded by metallicity on a Toomre diagram. Dashed lines indicate constant total space velocity. The star *eta Boo, attributed to the thick disc, is marked with a star symbol. |
| In the text | |
|
Fig. 4. Atmospheric parameters derived in this study (Teff, left; log g, middle; and [Fe/H], right) compared with values from studies listed in Sect. 3.1. |
| In the text | |
|
Fig. 5. Log g versus Teff diagram. Locations of *iot Gem (1.37 M⊙) and HD 179094 (1.03 M⊙) below the RGB luminosity bump are denoted by red arrows, on the PARSEC evolutionary tracks for solar metallicity from Bressan et al. (2012). |
| In the text | |
|
Fig. 6. Element-to-iron abundance ratios from this work and Paper I as a function of [Fe/H]. Circles represent red giant branch (RGB) stars, plus signs indicate subgiant stars, and the triangles denote red clump stars. Blue symbols correspond to stars at the evolutionary stage below the RGB luminosity bump, while red symbols indicate stars above the bump. Green symbols mark stars of the thick disc. The solid line represents the Galactic chemical evolution model for the thin disc by Pagel & Tautvaisiene (1995). Grey plus signs represent [El/Fe] abundances of thin-disc RGB stars from Tautvaišienė et al. (2022) for comparison. |
| In the text | |
|
Fig. 7. Comparison of 12C/13C and C/N ratios with theoretical models. Solid green and black lines correspond to first dredge-up (1 DUP) models from Lagarde et al. (2012) and Charbonnel et al. (2017), respectively. The green dashed line represents the minimal values in the model with thermohaline-induced extra-mixing (TH) from Lagarde et al. (2017), while the dashed black line shows minimal values in the model with thermohaline- and rotation-induced extra-mixing (TH+ROT) from Charbonnel et al. (2017). Symbols are the same as in Fig. 6. |
| In the text | |
|
Fig. 8. NLTE lithium abundance as a function of log g for stars with different masses. The lines represent models for stars evolving from the subgiant branch to the RGB tip; solid lines show the 1DUP, the dashed lines represent the models with thermohaline- and rotation-induced mixing from Lagarde et al. (2012). Black lines correspond to Z = 0.014, pink lines to Z = 0.004, and green lines to Z = 0.002. Symbol meanings are the same as in Fig. 6. Unfilled symbols represent upper lithium abundance limits. The Li-rich star is marked with a red star symbol. |
| In the text | |
|
Fig. 9. NLTE lithium abundance versus mass. Symbols are the same as in Fig. 8. Unfilled symbols denote upper limits. Theoretical models are from Charbonnel & Lagarde (2010), computed for solar metallicity and mass stars. The solid black line represents lithium abundances predicted at the 1DUP (1 DUP), the dashed line corresponds to thermohaline-induced mixing (TH), and the dot-dashed line indicates minimal values in the model with thermohaline- and rotation-induced extra-mixing (TH+ROT) with the rotation on Zero Age Main Sequence (ZAMS) equal to approximately 110 km s−1. |
| In the text | |
|
Fig. 10. Comparison of LTE lithium abundances as a function of log g with results from Magrini et al. (2021b). Symbols are the same as in Fig. 8. Plus signs indicate the LTE lithium abundances from (Magrini et al. 2021b). The smaller plus signs denote upper limits. Blue symbols mark lower RGB stars, red symbols indicate upper RGB stars, and yellow symbols represents clump stars. |
| In the text | |
|
Fig. 11. NLTE lithium abundance as a function of 12C/13C. Symbols are the same as in Fig. 8. The dashed line represents a linear, statistically insignificant fit to first-ascent giants, with a PCC of 0.48. |
| In the text | |
Current usage metrics show cumulative count of Article Views (full-text article views including HTML views, PDF and ePub downloads, according to the available data) and Abstracts Views on Vision4Press platform.
Data correspond to usage on the plateform after 2015. The current usage metrics is available 48-96 hours after online publication and is updated daily on week days.
Initial download of the metrics may take a while.