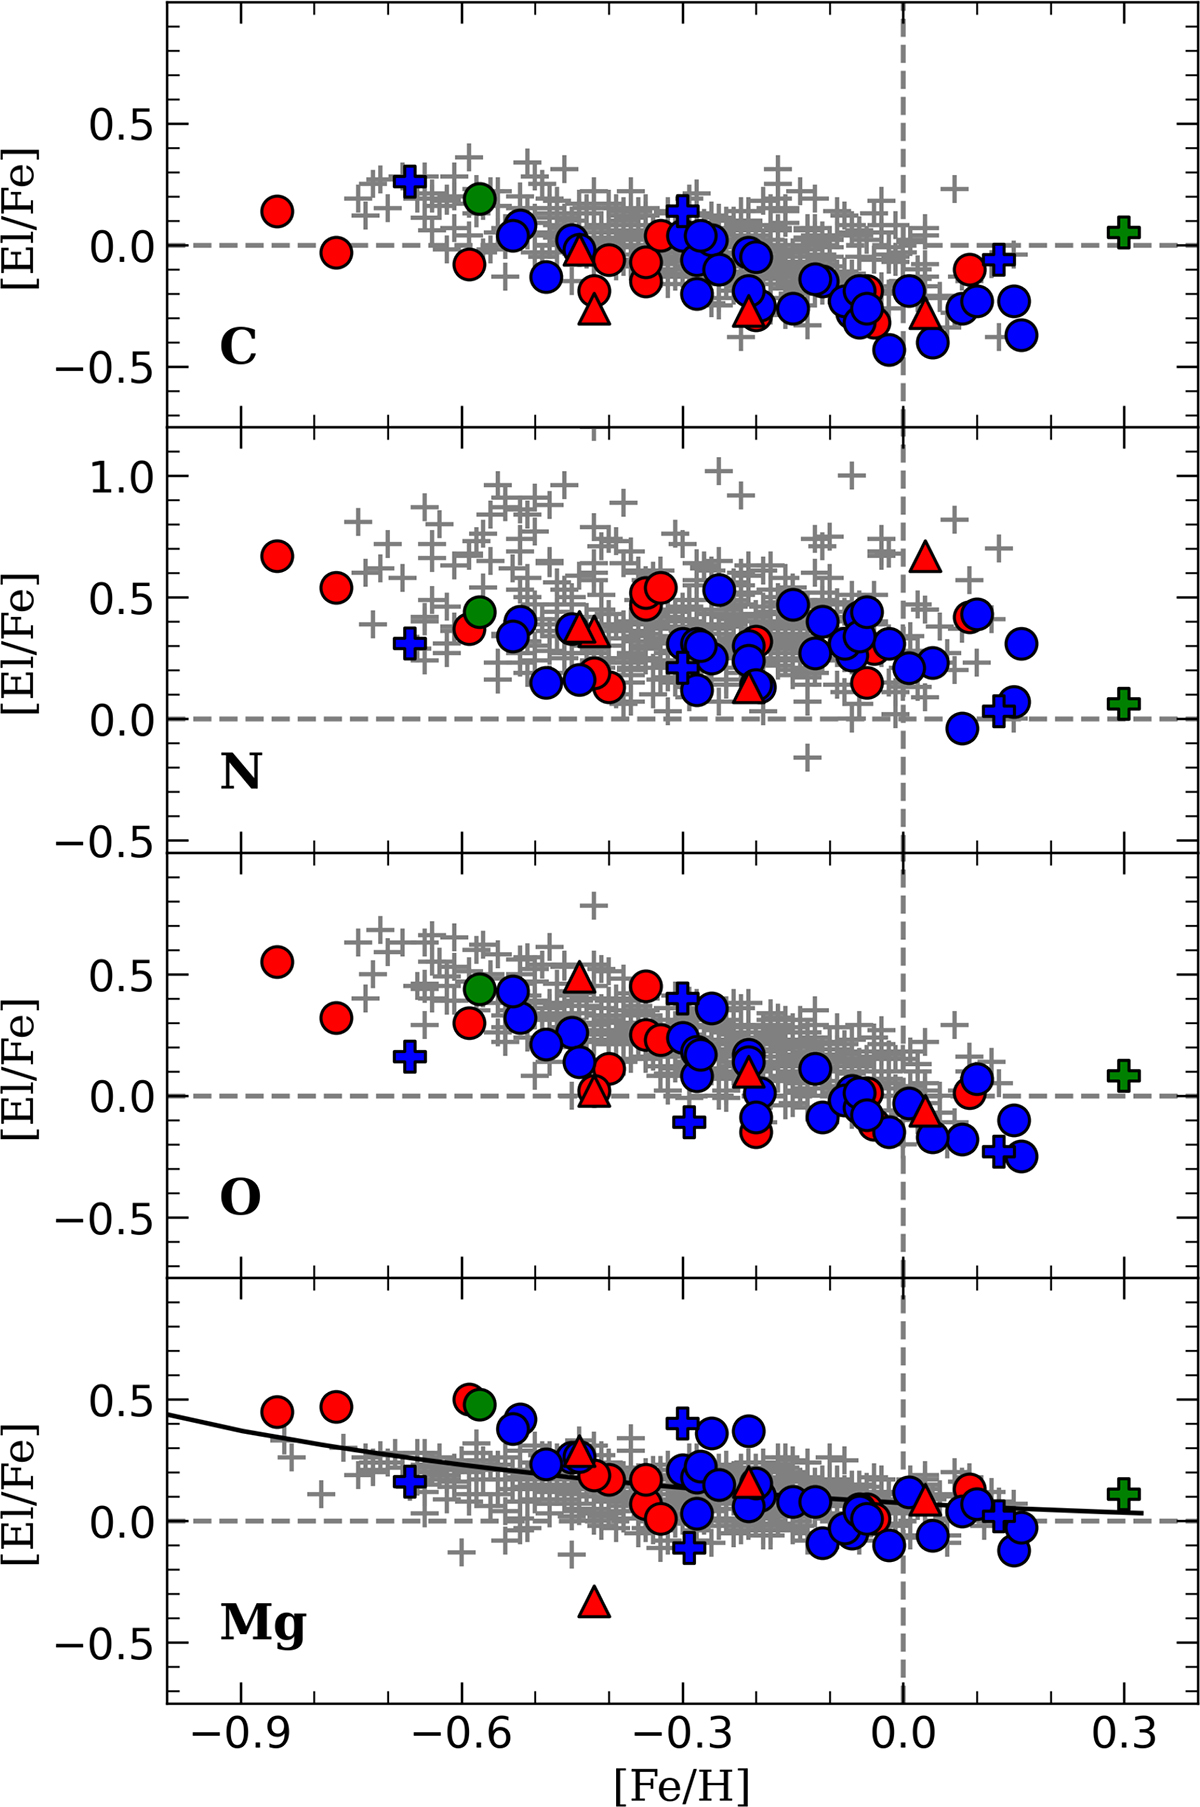
Fig. 6.
Download original image
Element-to-iron abundance ratios from this work and Paper I as a function of [Fe/H]. Circles represent red giant branch (RGB) stars, plus signs indicate subgiant stars, and the triangles denote red clump stars. Blue symbols correspond to stars at the evolutionary stage below the RGB luminosity bump, while red symbols indicate stars above the bump. Green symbols mark stars of the thick disc. The solid line represents the Galactic chemical evolution model for the thin disc by Pagel & Tautvaisiene (1995). Grey plus signs represent [El/Fe] abundances of thin-disc RGB stars from Tautvaišienė et al. (2022) for comparison.
Current usage metrics show cumulative count of Article Views (full-text article views including HTML views, PDF and ePub downloads, according to the available data) and Abstracts Views on Vision4Press platform.
Data correspond to usage on the plateform after 2015. The current usage metrics is available 48-96 hours after online publication and is updated daily on week days.
Initial download of the metrics may take a while.