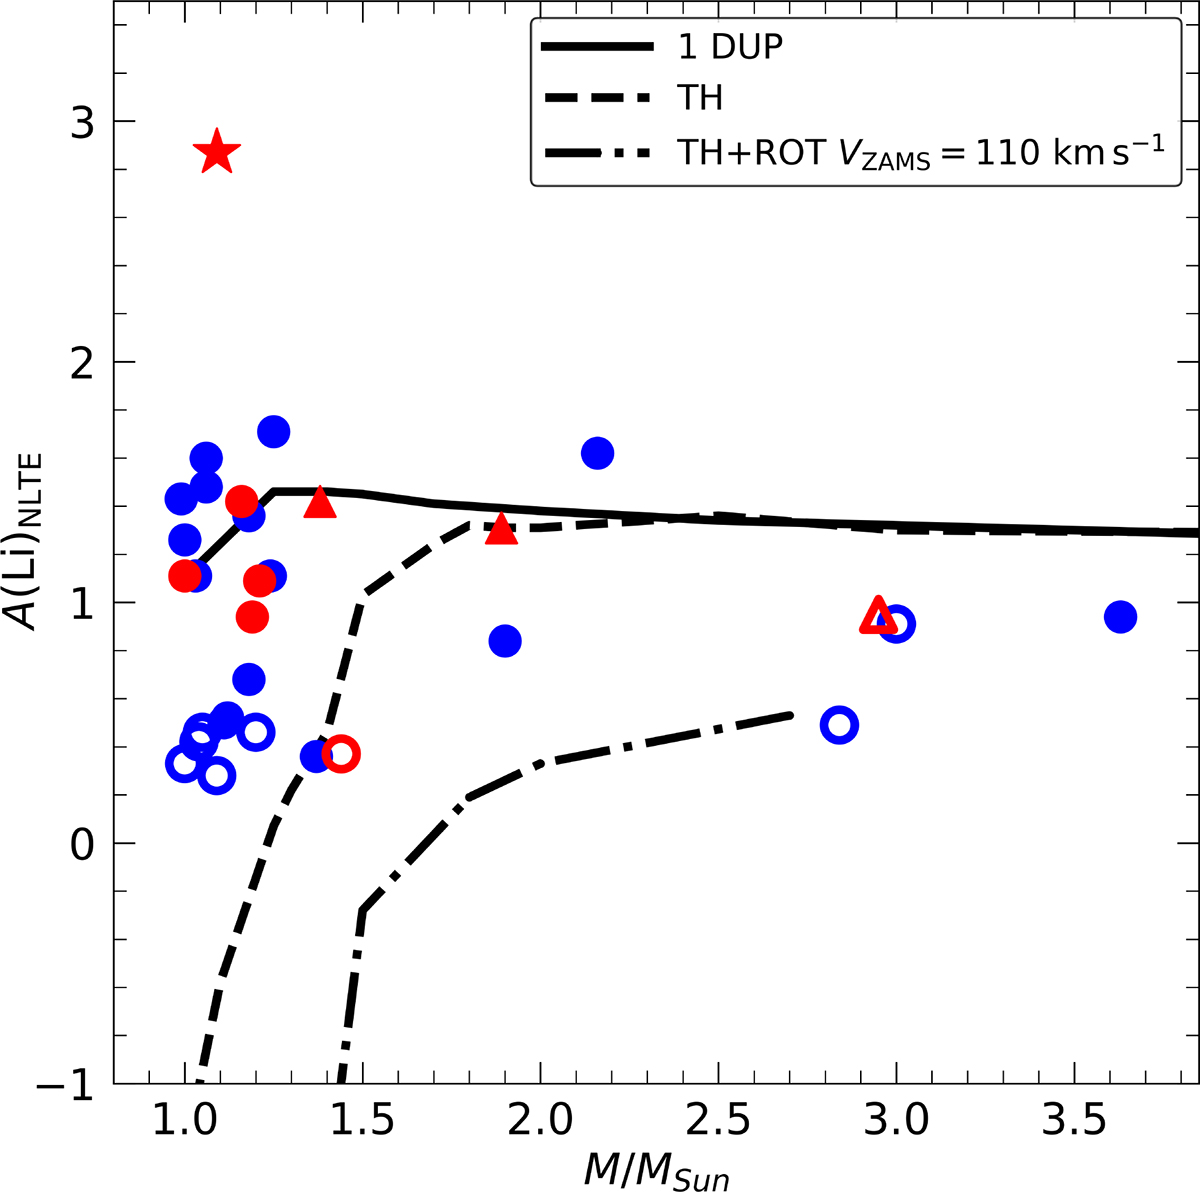
Fig. 9.
Download original image
NLTE lithium abundance versus mass. Symbols are the same as in Fig. 8. Unfilled symbols denote upper limits. Theoretical models are from Charbonnel & Lagarde (2010), computed for solar metallicity and mass stars. The solid black line represents lithium abundances predicted at the 1DUP (1 DUP), the dashed line corresponds to thermohaline-induced mixing (TH), and the dot-dashed line indicates minimal values in the model with thermohaline- and rotation-induced extra-mixing (TH+ROT) with the rotation on Zero Age Main Sequence (ZAMS) equal to approximately 110 km s−1.
Current usage metrics show cumulative count of Article Views (full-text article views including HTML views, PDF and ePub downloads, according to the available data) and Abstracts Views on Vision4Press platform.
Data correspond to usage on the plateform after 2015. The current usage metrics is available 48-96 hours after online publication and is updated daily on week days.
Initial download of the metrics may take a while.