Fig. 1
Download original image
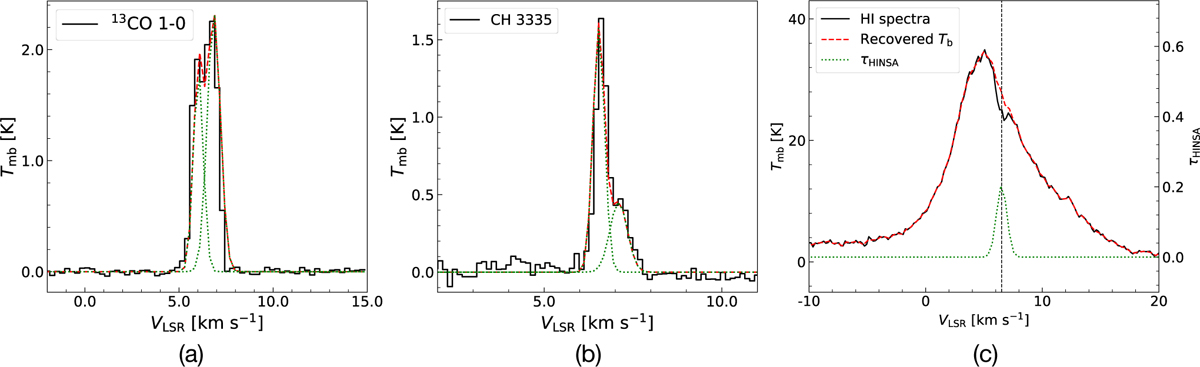
Example presenting the (a) 13CO, (b) CH 3335 MHz, and (c) H I spectra toward G168.13-16.39. In subplots (a) and (b), the dashed red curve represents the Gaussian fitting results, while the dotted green curves represent each component. In subplot (c), the dashed red curve denotes the recovered background H I emission without absorption (Tb). The dotted green and vertical black lines denote the decomposed τ and Vlsr of HINSA, respectively.
Current usage metrics show cumulative count of Article Views (full-text article views including HTML views, PDF and ePub downloads, according to the available data) and Abstracts Views on Vision4Press platform.
Data correspond to usage on the plateform after 2015. The current usage metrics is available 48-96 hours after online publication and is updated daily on week days.
Initial download of the metrics may take a while.