Open Access
Fig. 1.
Download original image
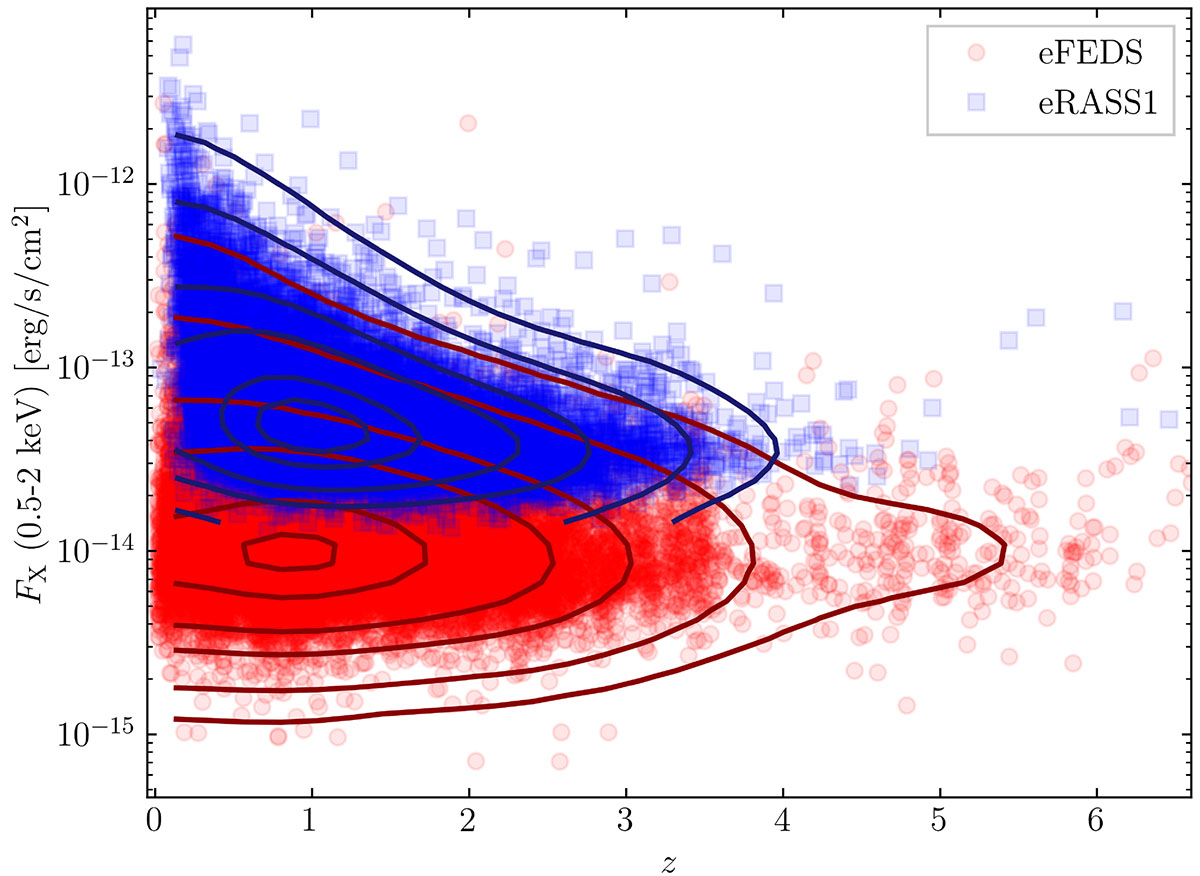
Flux in the 0.5–2 keV band versus redshift for the source in the eFEDS (red circles) and eRASS1 (blue squares) parent samples. Given the high density of objects, contours with matching colors have been added to highlight the sources’ distributions.
Current usage metrics show cumulative count of Article Views (full-text article views including HTML views, PDF and ePub downloads, according to the available data) and Abstracts Views on Vision4Press platform.
Data correspond to usage on the plateform after 2015. The current usage metrics is available 48-96 hours after online publication and is updated daily on week days.
Initial download of the metrics may take a while.