Open Access
Fig. 3.
Download original image
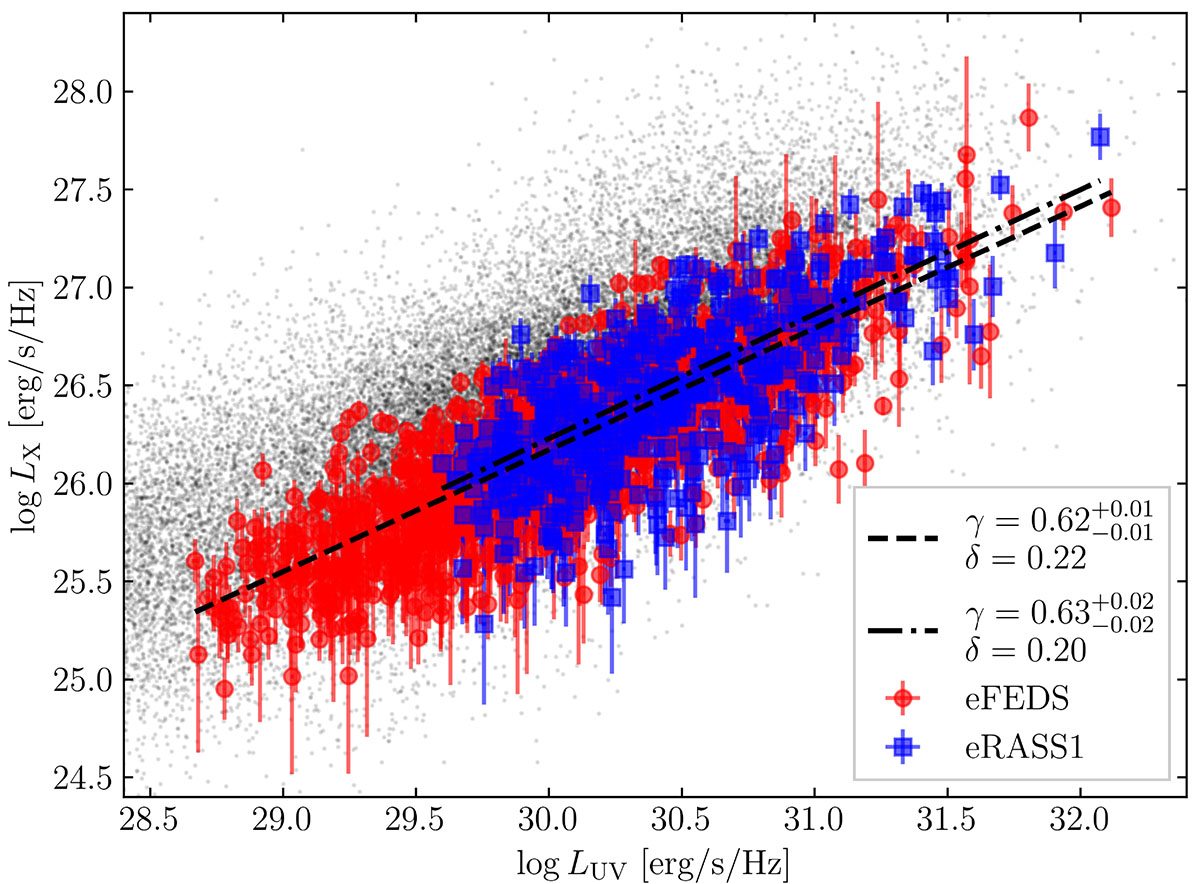
X-ray–UV relation. The eFEDS and eRASS1 data are shown with red circles and blue squares, respectively. The best fits for the samples are reported by the dashed and dash-dotted lines. The gray dots represent the eRASS and eFEDS parent sample, before any filtering has been applied.
Current usage metrics show cumulative count of Article Views (full-text article views including HTML views, PDF and ePub downloads, according to the available data) and Abstracts Views on Vision4Press platform.
Data correspond to usage on the plateform after 2015. The current usage metrics is available 48-96 hours after online publication and is updated daily on week days.
Initial download of the metrics may take a while.