Open Access
Fig. 4.
Download original image
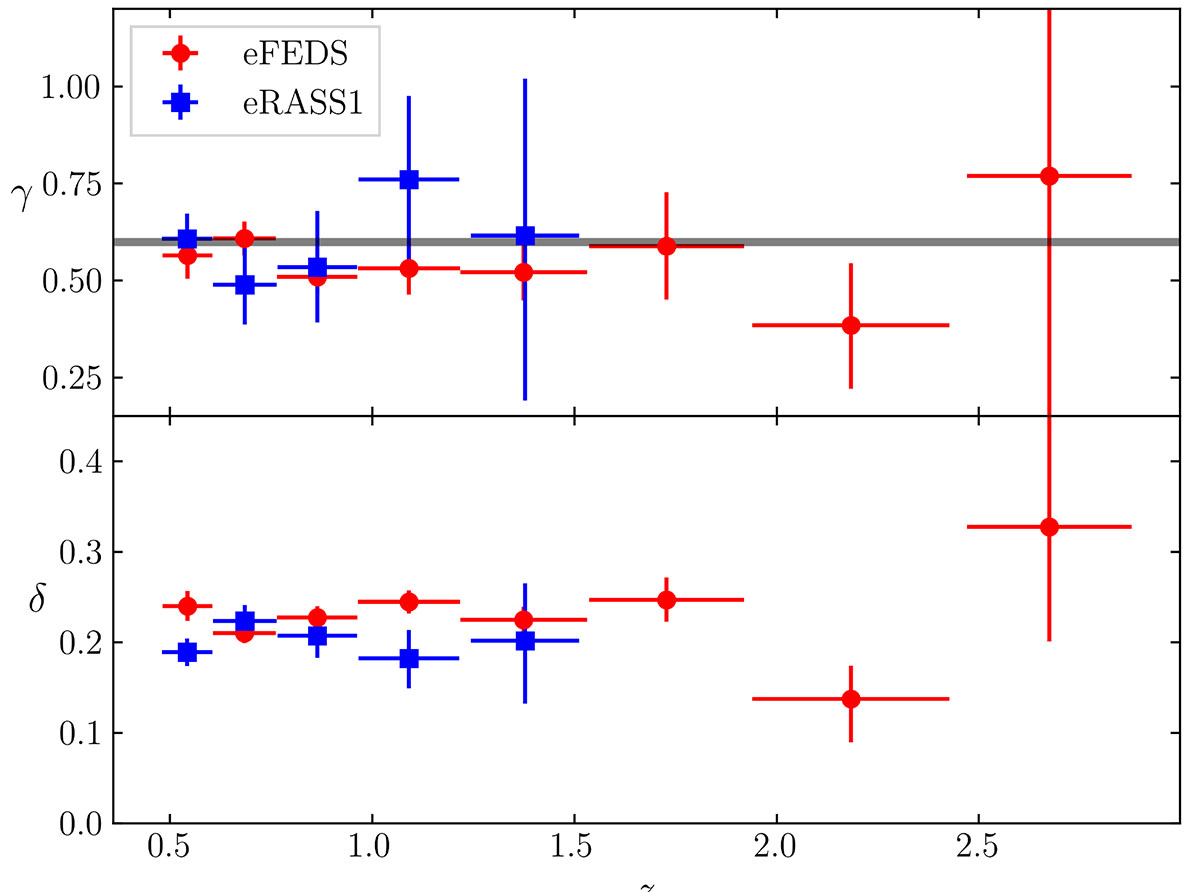
Parameters of the flux–flux relation as a function of redshift. Top: slope (γ). The gray line indicates the standard 0.6 value for the slope. Bottom: intrinsic dispersion (δ). The eFEDS and eRASS1 data are shown in blue and red, respectively.
Current usage metrics show cumulative count of Article Views (full-text article views including HTML views, PDF and ePub downloads, according to the available data) and Abstracts Views on Vision4Press platform.
Data correspond to usage on the plateform after 2015. The current usage metrics is available 48-96 hours after online publication and is updated daily on week days.
Initial download of the metrics may take a while.