Open Access
Fig. 5.
Download original image
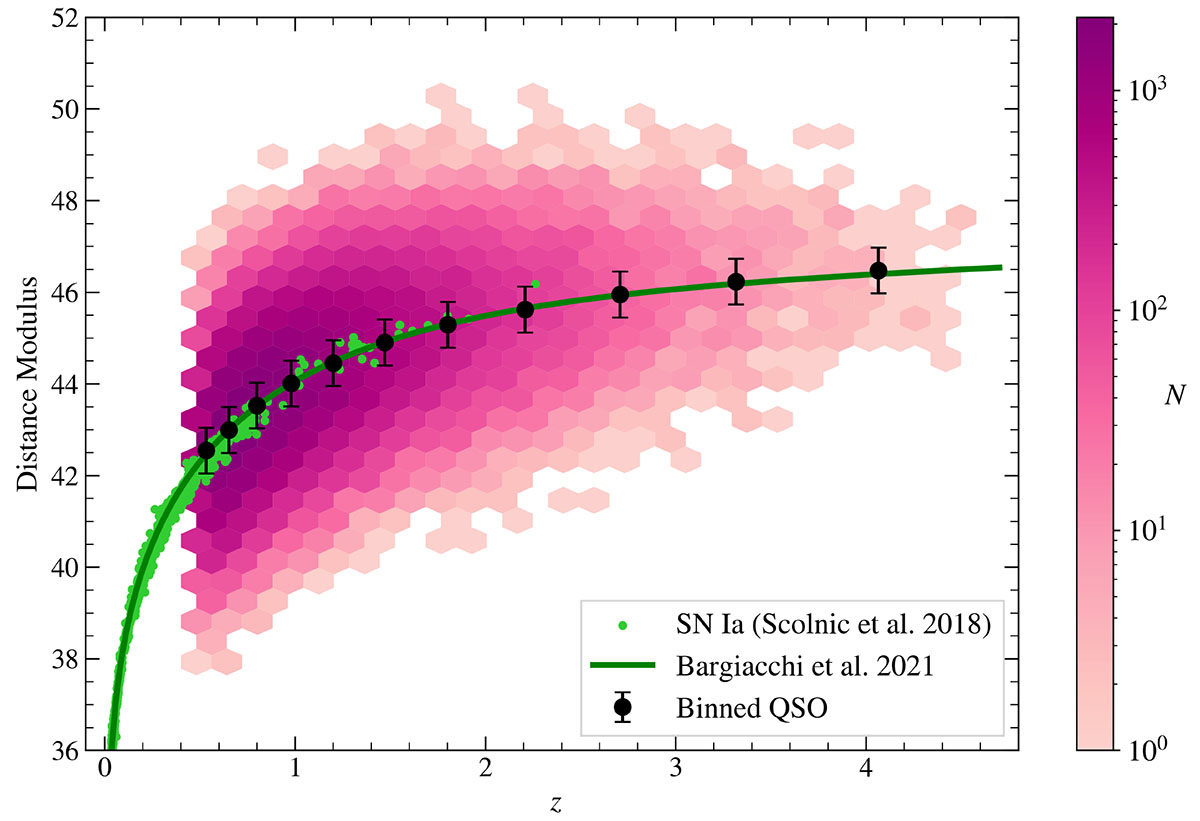
Hubble diagram for the simulated eRASS:4.5 sample. The density plot represents individual sources. Averaged values are indicated by black data points. The type Ia supernovae from Scolnic et al. (2018) are in light green. The solid darker green line shows the cosmographic model.
Current usage metrics show cumulative count of Article Views (full-text article views including HTML views, PDF and ePub downloads, according to the available data) and Abstracts Views on Vision4Press platform.
Data correspond to usage on the plateform after 2015. The current usage metrics is available 48-96 hours after online publication and is updated daily on week days.
Initial download of the metrics may take a while.