Fig. A.1.
Download original image
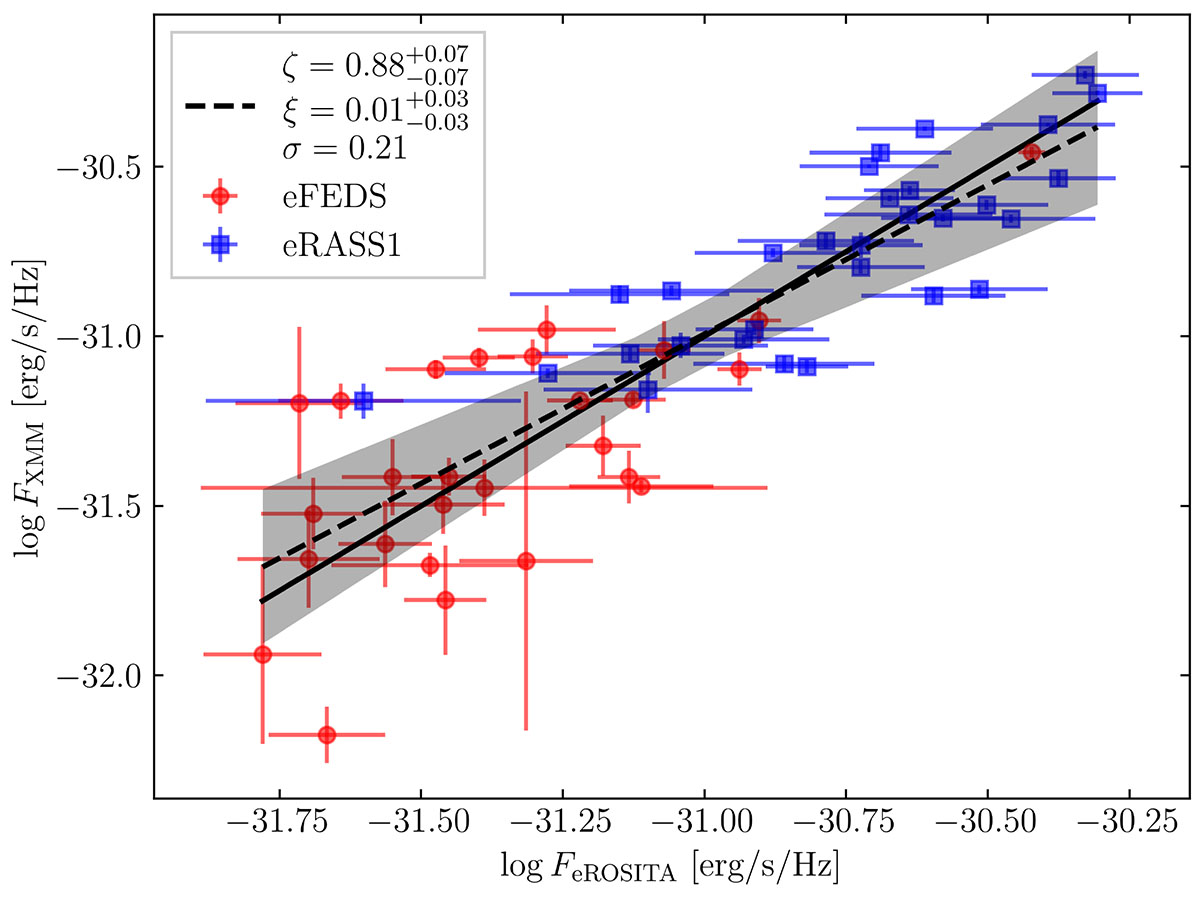
Monochromatic 2 keV flux densities obtained from XMM-Newton versus eROSITA data. The solid black line indicates the bisectrix. The best fit is shown by the dashed line, and 3σ uncertainties are indicated by the shaded area. Red circles and blue squares indicate whether eROSITA data come from eFEDS or eRASS1, respectively. The legend also reports the values obtained for the slope (ζ) and intercept (ξ).
Current usage metrics show cumulative count of Article Views (full-text article views including HTML views, PDF and ePub downloads, according to the available data) and Abstracts Views on Vision4Press platform.
Data correspond to usage on the plateform after 2015. The current usage metrics is available 48-96 hours after online publication and is updated daily on week days.
Initial download of the metrics may take a while.