| Issue |
A&A
Volume 703, November 2025
|
|
|---|---|---|
| Article Number | A73 | |
| Number of page(s) | 10 | |
| Section | Interstellar and circumstellar matter | |
| DOI | https://doi.org/10.1051/0004-6361/202556709 | |
| Published online | 06 November 2025 | |
High-energy interstellar isomers: cis-N-methylformamide in the G+0.693-0.027 molecular cloud
1
Star and Planet Formation Laboratory, Pioneering Research Institute (PRI), RIKEN,
2-1 Hirosawa,
Wako, Saitama
351-0198,
Japan
2
Centro de Astrobiología (CAB), INTA-CSIC,
Carretera de Ajalvir km 4, Torrejón de Ardoz,
28850
Madrid,
Spain
3
Dipartimento di Chimica “Giacomo Ciamician”, Università di Bologna,
via P. Gobetti 85,
40129
Bologna,
Italy
4
Departamento de Física de la Tierra y Astrofísica, Facultad de Ciencias Físicas, Universidad Complutense de Madrid,
28040
Madrid,
Spain
5
European Southern Observatory,
Alonso de Córdova 3107,
Vitacura
763 0355,
Santiago,
Chile
6
Joint ALMA Observatory,
Alonso de Córdova 3107,
Vitacura
763 0355,
Santiago,
Chile
★ Corresponding author: This email address is being protected from spambots. You need JavaScript enabled to view it.
Received:
1
August
2025
Accepted:
14
September
2025
Abstract
Context. Isomerism in complex organic molecules provides key insights into the formation mechanisms and physical conditions of the interstellar medium (ISM). Among the C2H5NO isomers, only acetamide and trans-N-methylformamide (trans-NMF) have been detected in space. The recent detection of higher-energy isomers in other chemical families raises questions about the formation and abundance of less stable isomers.
Aims. We aim to search for cis-N-methylformamide (cis-NMF), the next higher-energy conformer in the C2H5NO family, and investigate its possible formation pathways.
Methods. We used ultra-sensitive wide-band spectral surveys obtained with the Yebes 40 m and IRAM 30 m telescopes to search for cis-NMF towards the Galactic centre molecular cloud, G+0.693-0.027. A spectroscopic catalogue was extrapolated from literature data to aid the search.
Results. We present the first detection of cis-NMF in the ISM, with 55 unblended or slightly blended transitions, 44 of which were new transitions identified based on extrapolated spectroscopic data. Due to the lack of collisional rate coefficients, a quasi-non-LTE analysis, which separated the transitions into different Ka ladders, was used to determine the excitation conditions. The derived column density is (1.5±0.1) × 1013 cm−2, corresponding to a molecular abundance of (1.1 ±0.2) × 10−10 relative to H2. The resulting trans/cis-NMF isomeric ratio of 2.9±0.6 deviates significantly from thermodynamic expectations, suggesting that kinetic non-equilibrium processes and stereospecific chemical pathways are responsible for the formation of cis-NMF in this environment.
Conclusions. The detection of cis-NMF expands the known inventory of interstellar C2H5NO isomers and challenges the assumption that isomer abundances strictly correlate with thermodynamic stability. Laboratory and theoretical studies propose formation via CH3NCO hydrogenation or spin-forbidden reactions involving CH2 and NH2CHO, though these may not reflect typical ISM conditions. This finding highlights the need for further investigation into isomerisation mechanisms and constrains astrochemical models of complex organic molecules.
Key words: astrochemistry / ISM: abundances / ISM: clouds / ISM: molecules
© The Authors 2025
 Open Access article, published by EDP Sciences, under the terms of the Creative Commons Attribution License (https://creativecommons.org/licenses/by/4.0), which permits unrestricted use, distribution, and reproduction in any medium, provided the original work is properly cited.
This article is published in open access under the Subscribe to Open model. This email address is being protected from spambots. You need JavaScript enabled to view it. to support open access publication.
1 Introduction
Isomerism refers to molecules that share the identical molecular formula. They contain the same number and types of atoms but have different arrangements. In general, there are two main types of isomers: constitutional (or structural) isomers and stereoisomers (or spatial isomers). Structural isomers differ in connectivity, meaning they contain the same components but are bonded together in different ways. As a result, they are typically considered distinct molecules with different physical and chemical properties. Spatial isomers, on the other hand, have the exact same connectivity but differ in the spatial orientation of their constituting atoms and hence are expected to exhibit more similarities than structural isomers. A specific type of stereoisomer, spatial isomers (e.g. E/Z and cis/trans isomers), have substituent groups fixed in particular positions. In cis/trans isomerism, the groups are positioned on the same side (cis) or opposite sides (trans) of a reference plane. Alternatively, the E/Z notation is used to describe the relative positions of high-priority groups based on the Cahn-Ingold-Prelog priority rules (Favre & Powell 2013).
From an astronomical perspective, one important application of isomers is their use as a valuable tool for directly probing the physical and chemical processes occurring in the regions where they reside within the interstellar medium (ISM). In particular, since isomers share a similar level of chemical complexity and consist of the same constituent atoms, their conversion barriers and zero-point energy differences can primarily predict their existence and help elucidate the formation mechanisms responsible for the observed abundance ratios. By investigating the relative abundance ratio of 32 isomers across 14 species, Lattelais et al. (2009, 2010) proposed the concept of the ‘minimum energy principle’ (hereafter MEP), which is based on two main concepts: (1) the most thermodynamically stable isomer, i.e. with the lowest zero-point energy (ΔE), should be the most abundant; and (2) the relative abundance ratio between the most stable isomer and its higher-energy isomers appears to be closely correlated with the energy differences between them. Whilst the MEP has been shown to be generally applicable across various astronomical environments, studies of several families of structural isomers have cast doubt on this principle. Not only have the less stable, high-energy isomers (i.e. those predicted to be less likely observed) been robustly detected, but similar abundances have also been found between these high-energy isomers and their more stable counterparts (e.g. isomers of C3H2O, C2H4O2, and C2H5NO2; Loomis et al. 2015; Bermúdez et al. 2018; Mininni et al. 2020; Cabezas et al. 2021; Shingledecker et al. 2020; Rivilla et al. 2023).
In the case of spatial isomers, their isomeric abundance ratio, such as the anti and gauche conformers of ethyl formate (C2H5OCHO; Rivilla et al. 2017), the Aa and Ga conformers of n-propanol (n-C3H7OH Jiménez-Serra et al. 2022), the cis and trans conformers of thioformic acid (HC(O)SH García de la Concepción et al. 2022), and the Z and E isomers of imines (García de la Concepción et al. 2021; San Andrés et al. 2024) are plausibly explained by their predicted relative stabilities. In these cases, thermodynamic equilibrium can be reached especially when ground-state quantum tunnelling effects are taken into account (García de la Concepción et al. 2021, 2022). However, an increasing number of exceptions suggest that, rather than following thermodynamics, the observed isomeric abundance ratios may result from selective competitive chemical pathways (e.g. the cis and trans isomers of methyl formate (HC(O)OCH3), formic acid (HCOOH), and the cis–cis and cis–trans isomers of carbonic acid (HOCOOH) Neill et al. 2012; García de la Concepción et al. 2022, 2023; Sanz-Novo et al. 2025b). Altogether, these findings highlight a new opportunity to detect higher-energy isomers in the ISM. Detecting such isomers, especially those expected to be in low abundance or unlikely to be detected based on the MEP, will help to further elucidate the key factors governing isomeric abundance ratios in interstellar environments, whether determined by thermodynamic stability or by stereospecific chemical pathways.
Motivated by the recent detection of the higher-energy transisomer of methyl formate (ΔE = 25 kJ mol−1, or ~3000 K; Neill et al. 2012) as well as the identification of several amides, including acetamide (CH3CONH2) and trans-NMF, in the Galactic centre molecular cloud G+0.693-0.027 (hereafter G+0.693; Zeng et al. 2023; Sanz-Novo et al. 2025a), we report the first detection of cis-N-methylformamide (cis-CH3NHCHO; hereafter cis-NMF) in the ISM. G+0.693 is a chemically rich molecular cloud located within the Sgr B2 star-forming complex in the Central Molecular Zone (CMZ), the inner ~600 pc of the Galaxy. Over the past decade, numerous molecular species, including more than 25 newly identified in the ISM, have been detected towards this source (e.g. Jiménez-Serra et al. 2022; Rivilla et al. 2023; Zeng et al. 2023; San Andrés et al. 2024; Sanz-Novo et al. 2025a, and references therein).
cis-NMF belongs to the C2H5NO isomeric family and is the third member of this group to be detected in the ISM to date (Lattelais et al. 2010; Foo et al. 2018). The most stable isomer, acetamide, along with trans-NMF, which lies 10.1 kcal mol−1 (~5100 K) higher in energy than acetamide, have previously been detected in high-mass star-forming regions (Hollis et al. 2006; Halfen et al. 2011; Belloche et al. 2017; Ligterink et al. 2020; Colzi et al. 2021), in intermediate-mass regions (Ligterink et al. 2020), and in G+0.693 itself (Zeng et al. 2023). cis-NMF lies ~1.33 kcal mol−1 (~670 K) above trans-NMF (Kawashima et al. 2010) and is both a structural isomer of acetamide and a spatial isomer of trans-NMF. The detection of cis-NMF in the same physical environment as its more stable counterparts enables a direct comparison of excitation conditions and molecular abundances across the isomeric series, offering new constraints on the formation pathways and chemical stability of prebiotic molecules in the ISM.
2 Observations
We used the unbiased spectral surveys performed with the Yebes 40 m1 and IRAM 30 m2 telescopes to search for the cis conformer of CH3NHCHO towards the G+0.693 molecular cloud. The observations were centred at α(J2000) = 17h47m22s, δ(J2000) = –28°21′27″, and the position switching mode was employed with a reference position of Δα, Δδ = –885″, 290″ with respect to the source position. The line intensity of the spectra was measured in units of antenna temperature  since the molecular emission towards G+0.693 is extended over the beam (Jones et al. 2012; Li et al. 2020; Zeng et al. 2020; Zheng et al. 2024).
The Yebes 40m observations (project 21A014; PI Rivilla) were performed in multiple sessions between March 2021 and March 2022. The Nanocosmos Q-band (7 mm) HEMT receiver was employed to provide ultra-broadband observations (18.5 GHz) in two linear polarisations (Tercero et al. 2021). Fast Fourier transform spectrometer (FFTS) backends were used, providing a raw channel width of 38 kHz. The observations have a total frequency coverage of 31.07–50.42 GHz, and the half power beam width (HPBW) of the telescope was ~35″–55″ across the observed frequency range. The final spectra were smoothed to 256 kHz, which is equivalent to velocity resolutions of 1.5–2.5 km s−1, and the achieved root-mean-square (rms) noise level lies between 0.25–0.9 mK depending on the frequency.
For the IRAM 30m observations (project 123-22; PI: Jiménez-Serra), the Eight MIxer Receiver (EMIR) was connected to the fast Fourier transform spectrometer (FTS200) to provide a channel width of 200 kHz. In this work, data covering the spectral windows from 71.8 to 116.7 GHz were used, and the corresponding HPBW of telescope was ~ 21″–34″. The spectra were smoothed to velocity resolutions of 1.0–2.6 km s−1, and the achieved rms noise level lies between 1.3–2.8 mK depending on the frequency.
3 Analysis and results
3.1 Spectroscopic data of cis-NMF
The rotational spectrum of cis-NMF was recorded between 8 and 35 GHz by Fourier transform microwave spectroscopy (Kawashima et al. 2010). About one hundred transitions, exhibiting resolved nitrogen hyperfine structure and methyl internal rotation splitting, were assigned and successfully analysed using the rho-axis method. With the aim of preparing a spectral line catalogue to be used for astronomical purposes, we re-fitted the transitions observed by Kawashima et al. (2010) using the XIAM code (Hartwig & Dreizler 1996), which employs the internal axes method (IAM, Woods 1966; Vacherand et al. 1986) instead. Our results are equivalent in terms of fit quality, with the rms error of the lines being around 18 kHz. The spectroscopic parameters determined with XIAM and the electric dipole moment components computed in Kawashima et al. (2010, μa = 4.45 D and μb = 0.45 D at the MP2/6-31G** level of theory) were subsequently used to predict the rotational spectrum of cis-NMF in the 31–116 GHz range. Since molecular lines are typically observed towards G+0.693 with a full width at half maximum (FWHM) around 20 km s−1, the effect of the hyperfine structure was ignored, as it could not be spectrally resolved. Finally, the spectral predictions were reformatted in order to match the structure of a standard *.cat file (Pickett 1991).
To refine the ΔE between the two NMF conformers, we also performed new electronic structure computations using the software package Gaussian 16 (Frisch et al. 2016). Particularly, we conducted single-point energy calculations at the CCSD(T)/aug-cc-pVTZ level of theory on top of the B2PLYPD3/aug-cc-pVTZ-optimised geometries (shown in Fig. 1). We also computed harmonic vibrational frequencies at the B2PLYPD3/aug-cc-pVTZ level of theory to account for zero-point vibra-tional energy (ZPE) corrections. Thus, we obtained a ΔE = 1.4 kcal mol−1, which is in close agreement with the previously reported value of 1.3 kcal mol−1 computed by Kawashima et al. (2010) at the MP2/6-31G** level of theory.
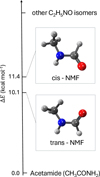 |
Fig. 1 Structure of cis-NMF (top) and trans-NMF (bottom), optimised at the B2PLYPD3/aug-cc-pVTZ level of theory, with nitrogen atoms in blue, oxygen atoms in red, hydrogen atoms in white, and carbon atoms in grey. |
3.2 Detection of cis-NMF
To search for cis-NMF, the prepared spectroscopic catalogue was imported into the Spectral Line Identification and Modelling (SLIM) tool within MADCUBA package3 (version 15/06/2024, Martín et al. 2019). In Table A.1, the unblended or slightly blended transitions of cis-NMF detected towards G+0.693 are listed with relevant spectroscopic information. We adopted the same criteria for identifying unblended or slightly blended transitions, as defined by Rey-Montejo et al. (2024) and Sanz-Novo et al. (2025b). Figure 2 shows, in the order of increasing frequency, the best-fitted line profiles of cis-NMF. The rest of the cis-NMF transitions covered in the spectral range of the survey are consistent with the observed spectra, being either blended with brighter transitions from other molecules or too weak to be securely detected. To accurately evaluate the potential line contamination by other species, emission from over 140 molecular species previously identified towards G+0.693 were considered in the overall fitting.
In total, 55 (28 E-state and 27 A-state) unblended or slightly blended transitions of cis-NMF are detected with an integrated signal-to-noise (S/N)4 ratio ≥5. Among the detected transitions, 11 below 33.95 GHz correspond to those previously measured in laboratory spectroscopic studies, while over 40 transitions at frequencies above 33.95 GHz are identified in this work based on extrapolated spectroscopic data. These detections represent the first direct identification of such transitions in the ISM, significantly extending the known spectroscopic range of cis-NMF.
Initially, all the line profiles were fitted under the assumption of local thermodynamic equilibrium (LTE) conditions in order to derive the physical parameters, using the AUTOFIT tool within MADCUBA-SLIM, which performs non-linear least-squares LTE fitting based on the Levenberg–Marquardt algorithm. However, several high Ka transitions were poorly fitted, suggesting that they are likely influenced by non-LTE effects. Since the collisional rate coefficients are not available, we performed a so-called quasi-non-LTE analysis which involves splitting the transitions into different Ka rotational ladders (e.g. Ka = 0, 1, and 2). Similar approaches have already been applied for the analysis of other molecules towards this cloud (e.g. Zeng et al. 2018; Rodríguez-Almeida et al. 2021; Sanz-Novo et al. 2025a) and appear as the only viable procedure to determine the excitation conditions of this molecule in G+0.693. A MADCUBA script, based on some of the newly developed tools, is provided as supplementary information in Appendix B. It enables the automatic separation of the transitions into the different Ka ladders and the re-computation of the rotational partition function accordingly. The derived physical parameters of cis-NMF are listed in Table 1.
To achieve the best LTE modelling, the radial velocity (vLSR) and the FWHM were fixed at 68 km s−1 and 20 km s−1, respectively, while the excitation temperature (Tex) and column density (N) were left as free parameters. The resulting Tex values derived from each individual Ka ladder range from 8 to 14 K, which is consistent with those obtained for all amide species as well as other complex organic molecules (COMs) detected towards G+0.693 (e.g. Requena-Torres et al. 2008; Rivilla et al. 2022; Zeng et al. 2023). The total molecular column density, computed as the sum of the column density of all the individual Ka ladders, is estimated to be (1.5±0.1) × 1013 cm−2. This translates to a molecular abundance with respect to H2 of (1.1±0.2) × 10−10, assuming  with an uncertainty of 15% (Martín et al. 2008). Adopting the molecular abundance of trans-NMF = (3.2±0.3) × 10−10 from Zeng et al. (2023), the trans/cis-NMF ratio is derived to be 2.9±0.6.
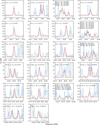 |
Fig. 2 Unblended or slightly blended transitions of cis-N-methylformamide detected towards G+0.693 arranged in order of increasing frequency. The grey histogram and shaded area correspond to the observed spectra. The blue lines depict the synthetic spectra, accounting for contributions from all detected molecular species (over 140) in G+0.693. The red line indicates the best LTE fit provided by MADCUBA. The quantum numbers and Eu values for each detected transition are listed in the upper left corner of each panel. |
Relative stabilities, dipole moments, and abundances of detected C2H5NO isomers towards G+0.693.
4 Discussion
Due to the lack of available spectroscopic data, higher-energy isomers of the C2H5NO family, other than acetamide, trans-NMF, and cis-NMF, cannot yet be searched for. Table 1 summarises their relative stabilities in terms of ΔE, dipole moment (μ), derived column densities, and the corresponding abundances relative to H2 towards G+0.693. According to the MEP, the most stable isomer should be the most abundant. In this regard, the observed molecular abundance of these three C2H5NO isomers appear to follow the principle qualitatively, with lower abundances corresponding to higher energies. However, if the isomeric abundance ratio is assumed to be governed by thermo-dynamic equilibrium, it should scale with exp(–ΔE/Tk), where ΔE is the zero-point energy difference and Tk is the gas kinetic temperature. Considering that Tk of G+0.693 is in the range of 70–140 K (Zeng et al. 2018) and ΔE(trans/cis) = 670 K, the thermodynamically expected trans/cis-NMF ratio should should range from 120 to 14 350, more than an order of magnitude higher than the actual observed value of 2.9±0.6. In addition, the direct isomerisation of trans-NMF has an energy barrier of ~20 kcal mol−1 (or 10 300 K; Tsai et al. 2022), which is unlikely to be overcome under typical ISM conditions. It is thus implicitly suggested that thermodynamic equilibrium cannot be attained between cis/trans-NMF.
cis-NMF has largely been overlooked in both observational and theoretical studies, primarily because of its higher energy and presumed low abundance, which rendered it unlikely to be detectable in the ISM. As a result, current chemical models (e.g. Belloche et al. 2019; Garrod et al. 2022) have typically included only the trans conformer, which was the sole isomer detected prior to this study. Consequently, trans-NMF has generally been treated as the representative NMF species in astrochemical modelling. Although no efficient gas-phase formation route is currently known for NMF, several formation pathways on grain surfaces have been proposed. These include radical–radical reactions such as HNCHO + CH3 (Belloche et al. 2017; Garrod et al. 2022) and CH3NH + HCO (Frigge et al. 2018). HNCHO may form either through radical addition (e.g. NH + CHO) or via the cosmic ray-induced photodissociation of NH2CHO, while CH3NH is thought to result from the irradiation of CH3NH2 by energetic electrons. Another proposed grain–surface pathway involves the hydrogenation of CH3NCO (Belloche et al. 2017). A more detailed discussion of these formation mechanisms in the context of G+0.693 can be found in Zeng et al. (2023).
One available study addressing the formation of cis-NMF is the laboratory experiment conducted by Tsai et al. (2022), which demonstrated a hydrogen-atom-assisted isomerisation mechanism. The proposed scheme begins with barrierless H-abstraction of trans-NMF, leading to the formation of the trans- · C(O)NHCH3 radical, followed by a second H-abstraction to produce CH3NCO. Once CH3NCO is formed, hydrogenation results in the cis- · C(O)NHCH3 radical, which subsequently undergoes further hydrogenation to yield cis-NMF. Although the experiment was conducted in solid para-hydrogen – an environment not directly representative of astronomical conditions – it provides an important insight into the formation mechanism of NMF isomers. Specifically, due to steric hindrance, the hydrogenation of CH3NCO was found to yield exclusively cis-NMF, without producing the trans-conformer. This result is in agreement with laboratory ice experiments, where CH3NCO is efficiently formed. However, trans-NMF remains undetected in CH4:HNCO ice mixtures, suggesting that hydrogenation of CH3NCO in interstellar ice analogues may not lead to the formation of trans-NMF (Ligterink et al. 2018).
In G+0.693, CH3NCO has been detected with a relative abundance of 4.9×10⁻¹⁰ (Zeng et al. 2018), which is about one order of magnitude higher than that of cis-NMF and less than a factor of two higher than trans-NMF. However, this abundance pattern alone is insufficient to confirm the formation pathway. Further laboratory studies involving the hydrogenation of pure CH3NCO under astrophysical relevant conditions are required to determine whether this process can account for the observed abundances of both NMF conformers.
Another study, based on a computational investigation, proposed that a spin-forbidden reaction between CH2 and NH2CHO could serve as a potential formation mechanism for both trans-NMF and cis-NMF in the gas phase (Mirzanejad & Varganov 2025). According to the calculations, the overall formation pathway is barrierless. It first produces an intermediate that exists as two chiral isomers, each of which can proceed to a transition state structure, ultimately forming the non-chiral trans-NMF and cis-NMF via hydrogen abstraction. The calculations suggest that the formation of cis-NMF is more favourable, as its pathway is barrierless, whereas the formation of trans-NMF involves a barrier of 1.9 kcal mol−1 (or 956 K) and thus depends on the probability of hydrogen tunnelling through this barrier. However, as noted by the authors, trans-NMF is ~1.33 kcal mol−1 more stable than cis-NMF. As a result, the rate constants for the formation of both isomers are expected to be comparable, suggesting that they could form in similar abundances. However, the detection of both trans-NMF and cis-NMF in G+0.693, with observed abundances differing by a factor of three, indicates that this formation pathway alone cannot fully account for the observations. Moreover, as the proposed mechanism involves a spin-forbidden reaction, a relatively uncommon process in astrochemical models, further detailed kinetic studies are essential. In particular, investigations into spin-inversion probabilities, reaction rate constants, and quantum tunnelling efficiencies are needed to better understand the observed abundance ratio and to provide deeper insight into the formation mechanisms of these isomers in the ISM.
5 Conclusions
We report the first interstellar detection of cis-N-methylformamide (cis-NMF, cis-CH3NHCHO) towards the Galactic centre molecular cloud G+0.693-0.027, marking it as the third confirmed isomer of the C2H5NO family observed in space. Using ultra-sensitive spectral data from the Yebes 40 m and IRAM 30 m telescopes, we identify 55 unblended or slightly blended transitions of cis-NMF and determine a column density of (1.5±0.1) × 1013 cm−2. This corresponds to an abundance of (1.1±0.2) × 10−10 relative to H2, resulting in a trans/cis abundance ratio of 2.9±0.6.
It is worth noting that existing spectroscopic studies have only reported transitions up to 33.95 GHz. Consequently, any transitions detected in this work beyond that frequency represent the first direct identifications in the ISM. Although these detections are based on extrapolated spectroscopic data, the broad linewidth typically observed towards G+0.693 mitigates any significant impact on our analysis. However, this highlights a critical need for the laboratory spectroscopic study to extend measurements into the millimetre-wave regime. Expanding the available spectroscopic datasets will be essential for improving the accuracy and reliability of molecular identifications in future astronomical surveys, particularly in chemically rich environments such as G+0.693.
The resulting trans/cis ratio of 2.9±0.6 determined in G+0.693 is qualitatively consistent with MEP, yet it deviates significantly from the value expected under thermodynamic equilibrium. This discrepancy suggests that the observed abundance pattern cannot be attributed solely to thermal stability. Instead, the data support a scenario in which non-equilibrium chemical processes and stereospecific reaction pathways play a major role in shaping the isomeric distribution. The detection of a higher-energy isomer such as cis-NMF further challenges the general applicability of the MEP in the ISM and reinforces the need for more comprehensive kinetic modelling.
Although laboratory and theoretical studies suggest that formation routes involving hydrogen-atom-assisted isomerisation or barrierless radical reactions could preferentially lead to the production of cis-NMF, the former does not reflect an astronomically relevant environment, while the latter involves a relatively unconventional mechanism. More broadly, the limited detections of molecules, particularly higher-energy isomers, pose significant constraints on the investigation of their formation pathways. The chemistry of not only trans/cis-NMF but also other isomers of C2H5NO remains poorly understood. This discovery adds an important piece to the puzzle of complex organic chemistry in space and highlights the chemical richness of G+0.693 as a valuable natural laboratory for studying conformational isomerism and molecular evolution in the ISM.
Acknowledgements
We thank the anonymous referee for their careful review. S.Z. acknowledge the support by RIKEN Special Postdoctoral Researchers Program. V.M.R., L.C., I.J-.S., A.M., D.S.A., and A.L.-G. acknowledge support from the grant PID2022-136814NB-I00 by the Spanish Ministry of Science, Innovation and Universities/State Agency of Research MICI-U/AEI/10.13039/501100011033 and by ERDF, UE; V.M.R. D.S.A., and A.L.-G. acknowledge the funds provided by the Consejo Superior de Investigaciones Científicas (CSIC) and the Centro de Astrobiología (CAB) through the project 20225AT015 (Proyectos intramurales especiales del CSIC). V.M.R. also acknowledges the grant RYC2020-029387-I funded by MICI-U/AEI/10.13039/501100011033 and by “ESF, Investing in your future”, and from the grant CNS2023-144464 funded by MICIU/AEI/10.13039/501100011033 and by “European Union NextGenerationEU/PRTR”. I.J.-S and A.M. also acknowledges support from ERC grant OPENS, GA No. 101125858, funded by the European Union. Views and opinions expressed are however those of the authors only and do not necessarily reflect those of the European Union or the European Research Council Executive Agency. D.S.A. also extends his gratitude for the financial support provided by the Comunidad de Madrid through the Grant PIPF-2022/TEC-25475. M.S.-N. also acknowledges a Juan de la Cierva Postdoctoral Fellow proyect JDC2022-048934-I, funded by MICIU/AEI/10.13039/501100011033 and by the European Union “NextGenerationEU/PRTR”. M.M. thanks the European Union – Next Generation EU under the Italian National Recovery and Resilience Plan (PNRR M4C2, Investment 1.4 – Call for tender no. 3138 dated 16/12/2021—CN00000013 National Centre for HPC, Big Data and Quantum Computing (HPC) – CUP J33C22001170001).
Appendix A List of unblended or slightly blended transitions of cis-NMF detected towards G+0.693-0.027
Table A.1 presents the spectroscopic information on unblended or slightly blended transitions of cis-NMF identified in G+0.693. It includes the rest frequencies of the transitions, quantum numbers, the base-10 logarithm of the integrated intensity at 300 K (log I), the energies of the upper levels for each transition (Eu), and any molecular species blended with the transitions.
Spectroscopic information on the unblended or slightly blended transitions of cis-NMF detected towards G+0.693.
Appendix B MADCUBA script for the Ka ladder separation analysis
The detailed MADCUBA script used in this study to perform the Ka ladder separation analysis for cis-NMF. It first separated the Ka ladder automatically. For each Ka ladder, the script first corrects the energy of the rotational levels by substracting the energy of the lower-state energy level (EL), and then recalculates the partition function as a direct summation of all the energy levels within each ladder. The AUTOFIT tool was then applied to obtain the best-fitting LTE model for the transitions of each Ka ladder, and the total column density was derived as a sum of the column density of each ladder.
# Running the macro in \ textsc {madcuba}
call (’MADCUBA_IJ. setActiveInformationMADCUBA’,
     false);
# Input file
spectraFile=’full_survey12may2023.fits’
# Output file
pathbase = "/Users/Kladderseparation/";
# Name and catalogue of the molecule
molecule = "USER$cis-N-CH3NHCHO";
# Maximum value of \textit{K}$_a$ to be
    included in the analysis
k_max = "6";
# To rename the molecule and separate the \
   textit{K}$_a$ = X transitions
var quote = "’"
new_mol=substring(molecule, indexOf(molecule, "
    $")+1);
molecules = quote+molecule+"$Any$Any$Any$"+
    quote;
rename_molecule = quote+new_mol+"_all"+quote;
f = File. open( pathbase + " /
    Kl adder_separation_analysis . txt") ;
print ("-----------------------------------") ;
print ("----K ladder separation----") ;
print ("-----------------------------------") ;
print (f, "--------------------------------");
print (f, "----K ladder separation----") ;
print (f, "-----------------------------------");
for (i=0; i<k_max;i++) { // 0; i<
   rename_molecule = quote+new_mol+"_K"+i+quote
       ;
   cond = quote+"CAST (id_QNN2 AS INTEGER)="+i+
       quote;
print ( " ----"+rename_molecule+"----");
print (f, "----" +rename_molecule+"----") ;
# Perform the SLIM search for the transitions
    belonging to each Ka ladder fall within the
     data. For found transitions , substract the
     Elow for each Ka ladder and update the
    partition function of the entry, which is
    computed by direct summation of the energy
    of all the levels included in each ladder
run(" SLIM Search", "range=’ selected_data’
    rename_molecule="+rename_molecule+" where=
    "+cond+" axislabel =’ Frequency’ axisunit=’
    Hz’ molecules="+molecules+"  searchtype=
    add datafile=" +spectraFile+" datatype=
    SPECTRA");
print( rename_molecule+ " is Search="+ call ("
   SLIM_Search. existsResult")) ;
existsSearch = call ("SLIM_Search. existsResult"
    );
if( existsSearch==’ true’)
{
  run ("SLIM Update Q Elow", " molecule=" +
      rename_molecule+" catalog=’ USER’
      subtract_elow=true where=" +cond+"
      partition=total") ;
  print("E_LOW_K_ladder (cm-1) ="+call("
      SLIM_Update_Q_Elow. getSubtractElow")) ;
  print("E_LOW_K_ladder (K) ="+(parseFloat(call
     ("SLI M_Update_Q_Elow. getSubtractElow"))
      *1.438777));
  print(f,"E_LOW_K_ladder (cm-1) ="+call("
      SLIM_Update_Q_Elow. getSubtractElow")) ;
  print(f,"E_LOW_K_ladder (K) ="+(parseFloat(
      call ("SLIM_Update_Q_Elow. getSubtractEl ow”
      ))*1.438777));
  }
}
print ("---------------------------") ;
print ("----End of K ladder separation----") ;
print ("-------------------------------------") ;
print (f, "-----------------------------------");
print (f, "----End of K ladder separation----") ;
print (f, "-----------------------------------");
File. close(f);
# Define the name of the molecule, the path of
    the output , the total number of Ka ladders
molecule = "USER$cis-N-CH3NHCHO";
num_k = 6;
pathbase=" /Users /Kladderseparation/" ;
var quote = " ’ "
new_mol =substring ( molecule , indexOf( molecule , "
    $")+1);
molecules = quote+molecule+"$Any$Any$Any$"+
    quote;
f = File. open( pathbase + " /Resul ts. txt") ;
energy = newArray(num_k);
logNladder = newArray(num_k);
elogNladder = newArray(num_k);
numFit = 0;
qLogN = 0;
eqlogN = 0;
# Reconstrut the name of each entry and compute
     the total column density of the molecule
    as a sum of the column density of each Ka
    ladder
for (i = 0; i < num_k; i++) {
    rename_molecule = quote+new_mol+"_K"+i+
        quote ;
    run("SLIM Select Molecule”, “molecule=” +
        rename_molecule) ;
    if (call(’SLIM_Parameters.getValue',  ’
        Autofit’) == "true") {
        logNladder[numFit] = log(10) *
            parseFloat(call(’SLIM_Parameters.
            getValue’,  ’logN|EM'));
        elogNladder[numFit] = log (10) *
            parseFloat(call(’sLIM_Parameters.
            getValue’, ’ delta logN| EM’)) ;
        energy[numFit] = 1.438777 * parseFloat(
            call (’ SLI M_Parameters . getValue’ ,  ’
            Eladder’));
        qLogN += pow(10, parseFloat(call ( ’
            SLIM_Parameters. getVal ue’ ,  ’ logN| EM
            ’)));
        eqLogN += pow(10, parseFloat( call ( ’
            SLIM_Parameters. getVal ue’ ,  ’ delta
            logN| EM’)));
    numFit++;
    }
}
# Adjust the arrays to the number of Ka ladders
     considered and print everything in the .
    log and in the output file
energy= Array. trim( energy, numFit) ;
logNladder= Array. trim( logNladder, numFit) ;
elogNladder= Array. trim( elogNladder, numFit) ;
//Array.show("DR values ",energy , logNladder,
    elogNladder, cqlogNladder, ecqlogNladder) ;
print ("---------------------------") ;
print ("---- Results----") ;
print ("---------------------------");
print ("Number of K ladders included in the
    analysis: “ + num_k);
print ("------------------------------") ;
print ("LogNtot (cm-2)  : " + log(qLogN) / log
    (10));
print ("Ntot (cm-2): " + qLogN);
print ("errorNtot (cm-2): " + eqLogN);
print ("--------------------------------------") ;
print ("----Termination of Results----");
print ("---------------------------------------") ;
print (f, "---------------------------------------") ;
print (f, "----Results----") ;
print (f, "---------------------------------------");
print (f, " Number of K ladders included in the
   analysis: “ + num_k) ;
print(f, "------------------------------------------");
print(f, " LogNtot (cm-2)  : " + log( qLogN) / log
    (10));
print(f, " Ntot ( cm-2) : " + qLogN) ;
print(f, " errorNtot ( cm-2) : " + eqLogN) ;
print(f, "-------------------------------------------");
print(f, "----Termination of Results----") ;
print(f, "---------------------------------------");
File. close( f);
References
- Belloche, A., Meshcheryakov, A. A., Garrod, R. T., et al. 2017, A&A, 601, A49 [NASA ADS] [CrossRef] [EDP Sciences] [Google Scholar]
- Belloche, A., Garrod, R. T., Müller, H. S. P., et al. 2019, A&A, 628, A10 [NASA ADS] [CrossRef] [EDP Sciences] [Google Scholar]
- Bermúdez, C., Tercero, B., Motiyenko, R. A., et al. 2018, A&A, 619, A92 [NASA ADS] [CrossRef] [EDP Sciences] [Google Scholar]
- Cabezas, C., Agúndez, M., Marcelino, N., et al. 2021, A&A, 654, A45 [NASA ADS] [CrossRef] [EDP Sciences] [Google Scholar]
- Colzi, L., Rivilla, V. M., Beltrán, M. T., et al. 2021, A&A, 653, A129 [NASA ADS] [CrossRef] [EDP Sciences] [Google Scholar]
- Favre, H. A., & Powell, W. H. 2013, Nomenclature of Organic Chemistry (The Royal Society of Chemistry) [Google Scholar]
- Foo, L., Surányi, A., Guljas, A., et al. 2018, Mol. Astrophys., 13, 1 [NASA ADS] [CrossRef] [Google Scholar]
- Frigge, R., Zhu, C., Turner, A. M., et al. 2018, ApJ, 862, 84 [NASA ADS] [CrossRef] [Google Scholar]
- Frisch, M. J., Trucks, G. W., Schlegel, H. B., et al. 2016, Gaussian~16 Revision C.01, Gaussian Inc. Wallingford, CT [Google Scholar]
- García de la Concepción, J., Jiménez-Serra, I., Carlos Corchado, J., Rivilla, V. M., & Martín-Pintado, J. 2021, ApJ, 912, L6 [CrossRef] [Google Scholar]
- García de la Concepción, J., Colzi, L., Jiménez-Serra, I., et al. 2022, A&A, 658, A150 [NASA ADS] [CrossRef] [EDP Sciences] [Google Scholar]
- García de la Concepción, J., Jiménez-Serra, I., Corchado, J. C., et al. 2023, A&A, 675, A109 [Google Scholar]
- Garrod, R. T., Jin, M., Matis, K. A., et al. 2022, ApJS, 259, 1 [NASA ADS] [CrossRef] [Google Scholar]
- Halfen, D. T., Ilyushin, V., & Ziurys, L. M. 2011, ApJ, 743, 60 [Google Scholar]
- Hartwig, H., & Dreizler, H. 1996, Z. Naturf. A, 51, 923 [Google Scholar]
- Hollis, J. M., Lovas, F. J., Remijan, A. J., et al. 2006, ApJ, 643, L25 [Google Scholar]
- Jiménez-Serra, I., Rodríguez-Almeida, L. F., Martín-Pintado, J., et al. 2022, A&A, 663, A181 [NASA ADS] [CrossRef] [EDP Sciences] [Google Scholar]
- Jones, P. A., Burton, M. G., Cunningham, M. R., et al. 2012, MNRAS, 419, 2961 [Google Scholar]
- Kawashima, Y., Usami, T., Suenram, R. D., Golubiatnikov, G. Y., & Hirota, E. 2010, J. Mol. Spectrosc., 263, 11 [Google Scholar]
- Kojima, T., Yano, E., Nakagawa, K., & Tsunekawa, S. 1987, J. Mol. Spectrosc., 122, 408 [Google Scholar]
- Lattelais, M., Pauzat, F., Ellinger, Y., & Ceccarelli, C. 2009, ApJ, 696, L133 [Google Scholar]
- Lattelais, M., Pauzat, F., Ellinger, Y., & Ceccarelli, C. 2010, A&A, 519, A30 [CrossRef] [EDP Sciences] [Google Scholar]
- Li, J., Wang, J., Qiao, H., et al. 2020, MNRAS, 492, 556 [Google Scholar]
- Ligterink, N. F. W., Terwisscha van Scheltinga, J., Taquet, V., et al. 2018, MNRAS, 480, 3628 [Google Scholar]
- Ligterink, N. F. W., El-Abd, S. J., Brogan, C. L., et al. 2020, ApJ, 901, 37 [Google Scholar]
- Loomis, R. A., McGuire, B. A., Shingledecker, C., et al. 2015, ApJ, 799, 34 [Google Scholar]
- Martín, S., Requena-Torres, M. A., Martín-Pintado, J., & Mauersberger, R. 2008, ApJ, 678, 245 [CrossRef] [Google Scholar]
- Martín, S., Martín-Pintado, J., Blanco-Sánchez, C., et al. 2019, A&A, 631, A159 [Google Scholar]
- Mininni, C., Beltrán, M. T., Rivilla, V. M., et al. 2020, A&A, 644, A84 [NASA ADS] [CrossRef] [EDP Sciences] [Google Scholar]
- Mirzanejad, A., & Varganov, S. A. 2025, ACS Earth Space Chem., 9, 789 [Google Scholar]
- Neill, J. L., Muckle, M. T., Zaleski, D. P., et al. 2012, ApJ, 755, 153 [Google Scholar]
- Pickett, H. M. 1991, J. Mol. Struct., 148, 371 [NASA ADS] [Google Scholar]
- Requena-Torres, M. A., Martín-Pintado, J., Martín, S., & Morris, M. R. 2008, ApJ, 672, 352 [Google Scholar]
- Rey-Montejo, M., Jiménez-Serra, I., Martín-Pintado, J., et al. 2024, ApJ, 975, 174 [NASA ADS] [CrossRef] [Google Scholar]
- Rivilla, V. M., Beltrán, M. T., Martín-Pintado, J., et al. 2017, A&A, 599, A26 [NASA ADS] [CrossRef] [EDP Sciences] [Google Scholar]
- Rivilla, V. M., Jiménez-Serra, I., Martín-Pintado, J., et al. 2022, Front. Astron. Space Sci., 9, 876870 [NASA ADS] [CrossRef] [Google Scholar]
- Rivilla, V. M., Sanz-Novo, M., Jiménez-Serra, I., et al. 2023, ApJ, 953, L20 [NASA ADS] [CrossRef] [Google Scholar]
- Rodríguez-Almeida, L. F., Jiménez-Serra, I., Rivilla, V. M., et al. 2021, ApJ, 912, L11 [Google Scholar]
- San Andrés, D., Rivilla, V. M., Colzi, L., et al. 2024, ApJ, 967, 39 [CrossRef] [Google Scholar]
- Sanz-Novo, M., Molpeceres, G., Rivilla, V. M., & Jimenez-Serra, I. 2025a, A&A, 698, A36 [NASA ADS] [CrossRef] [EDP Sciences] [Google Scholar]
- Sanz-Novo, M., Rivilla, V. M., Endres, C. P., et al. 2025b, ApJ, 980, L37 [Google Scholar]
- Shingledecker, C. N., Molpeceres, G., Rivilla, V. M., Majumdar, L., & Kästner, J. 2020, ApJ, 897, 158 [NASA ADS] [CrossRef] [Google Scholar]
- Tercero, F., López-Pérez, J. A., Gallego, J. D., et al. 2021, A&A, 645, A37 [EDP Sciences] [Google Scholar]
- Tsai, S.-Y., Haupa, K. A., & Lee, Y.-P. 2022, J. Am. Chem. Soc., 144, 12339 [NASA ADS] [CrossRef] [Google Scholar]
- Vacherand, J., Van Eijck, B., Burie, J., & Demaison, J. 1986, J. Mol. Spectrosc., 118, 355 [NASA ADS] [CrossRef] [Google Scholar]
- Woods, R. 1966, J. Mol. Spectrosc., 21, 4 [NASA ADS] [CrossRef] [Google Scholar]
- Zeng, S., Jiménez-Serra, I., Rivilla, V. M., et al. 2018, MNRAS, 478, 2962 [Google Scholar]
- Zeng, S., Zhang, Q., Jiménez-Serra, I., et al. 2020, MNRAS, 497, 4896 [NASA ADS] [CrossRef] [Google Scholar]
- Zeng, S., Rivilla, V. M., Jiménez-Serra, I., et al. 2023, MNRAS, 523, 1448 [NASA ADS] [CrossRef] [Google Scholar]
- Zheng, S., Li, J., Wang, J., et al. 2024, ApJ, 961, 58 [NASA ADS] [CrossRef] [Google Scholar]
The 40 m radiotelescope at Yebes Observatory is operated by the Spanish Geographic Institute (IGN, Ministerio de Transportes, Movilidad y Agenda Urbana.) https://rt40m.oan.es/rt40m_en.php
IRAM is supported by INSU/CNRS (France), MPG (Germany), and IGN (Spain).
Madrid Data Cube Analysis on ImageJ is a software developed at the Center of Astrobiology (CAB) in Madrid; http://cab.inta-csic.es/madcuba/
The S/N is computed from the integrated intensity  and noise level,
  , where δv is the spectral resolution and the FWHM is obtained from the best fitting.
All Tables
Relative stabilities, dipole moments, and abundances of detected C2H5NO isomers towards G+0.693.
Spectroscopic information on the unblended or slightly blended transitions of cis-NMF detected towards G+0.693.
All Figures
|
Fig. 1 Structure of cis-NMF (top) and trans-NMF (bottom), optimised at the B2PLYPD3/aug-cc-pVTZ level of theory, with nitrogen atoms in blue, oxygen atoms in red, hydrogen atoms in white, and carbon atoms in grey. |
| In the text | |
|
Fig. 2 Unblended or slightly blended transitions of cis-N-methylformamide detected towards G+0.693 arranged in order of increasing frequency. The grey histogram and shaded area correspond to the observed spectra. The blue lines depict the synthetic spectra, accounting for contributions from all detected molecular species (over 140) in G+0.693. The red line indicates the best LTE fit provided by MADCUBA. The quantum numbers and Eu values for each detected transition are listed in the upper left corner of each panel. |
| In the text | |
Current usage metrics show cumulative count of Article Views (full-text article views including HTML views, PDF and ePub downloads, according to the available data) and Abstracts Views on Vision4Press platform.
Data correspond to usage on the plateform after 2015. The current usage metrics is available 48-96 hours after online publication and is updated daily on week days.
Initial download of the metrics may take a while.