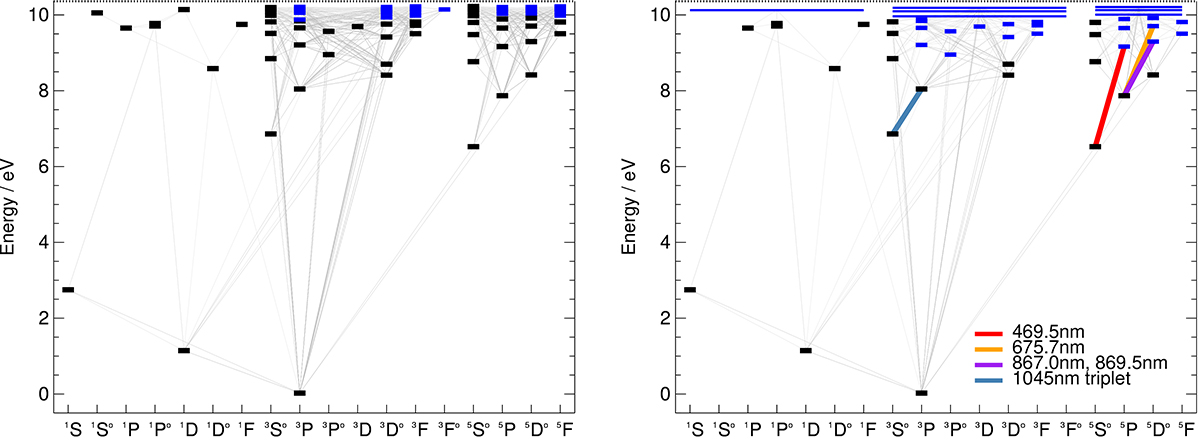
Fig. 2.
Download original image
Grotrian diagram for comprehensive (left) and reduced (right) model atoms used in this work. Terms for which fine-structure are unresolved are shown as short blue horizontal lines. Super levels in the reduced model atom are shown as long, blue horizontal lines. Transitions are shown as slanted grey lines; those used as abundance diagnostics are shown as coloured slanted lines in the right panel and labelled in the legend.
Current usage metrics show cumulative count of Article Views (full-text article views including HTML views, PDF and ePub downloads, according to the available data) and Abstracts Views on Vision4Press platform.
Data correspond to usage on the plateform after 2015. The current usage metrics is available 48-96 hours after online publication and is updated daily on week days.
Initial download of the metrics may take a while.