Fig. 5.
Download original image
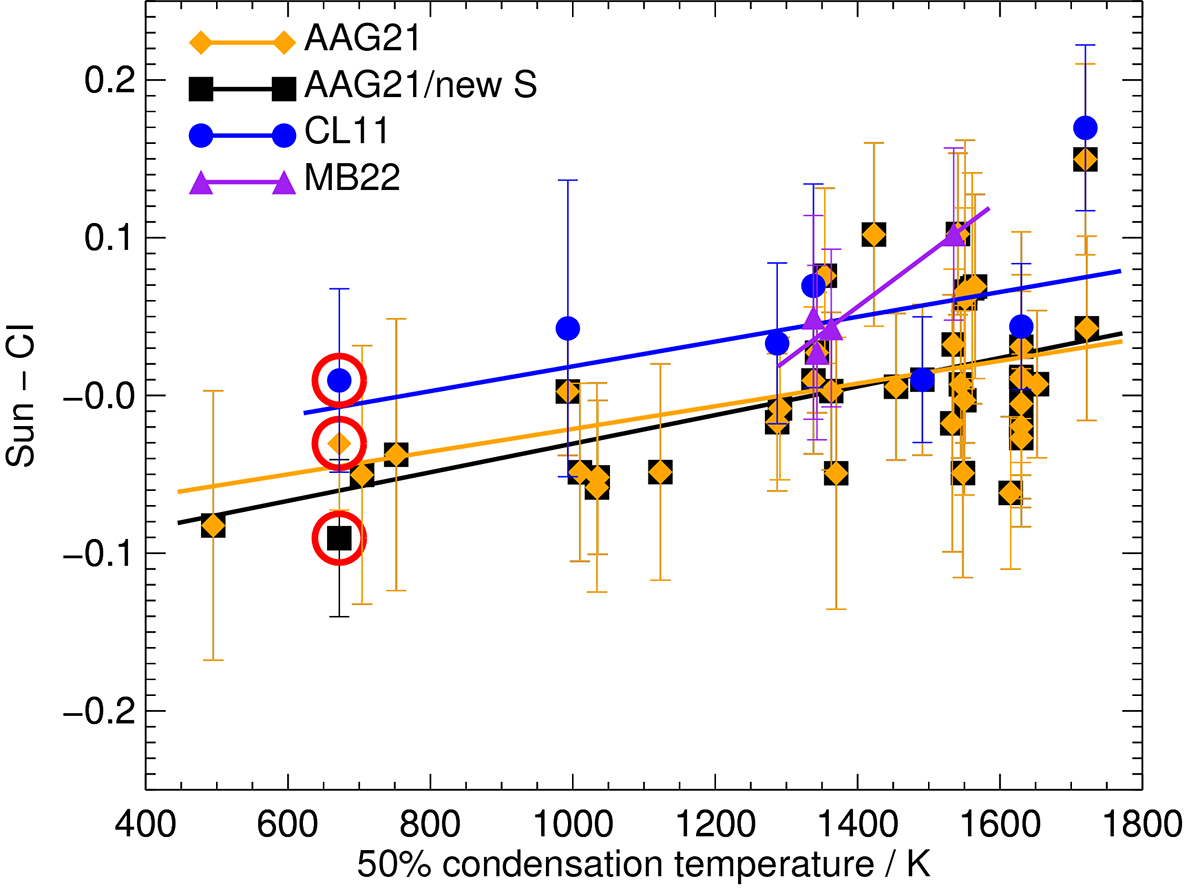
Photospheric versus CI chondrite abundance differences as function of 50% condensation temperature from Wood et al. (2019). Photospheric data AAG21, CL11, and MB22 are from Asplund et al. (2021), Caffau et al. (2011), and Magg et al. (2022), respectively, the latter being restricted to their derivations based on a horizontally and temporally averaged 3D model. CI chondrite data are from Lodders (2021) and were converted to the solar scale with A(Si) = 7.51 from Asplund et al. (2021). Only elements with combined uncertainties less severe than ±0.1 dex are included, and the reference element silicon is omitted from those data sets where it was available. Sulphur, with Tcond = 672 K, has been circled, and the new solar sulphur abundance found in this work was used to update AAG21, forming the AAG21/new S data set. Weighted linear regressions are overplotted.
Current usage metrics show cumulative count of Article Views (full-text article views including HTML views, PDF and ePub downloads, according to the available data) and Abstracts Views on Vision4Press platform.
Data correspond to usage on the plateform after 2015. The current usage metrics is available 48-96 hours after online publication and is updated daily on week days.
Initial download of the metrics may take a while.