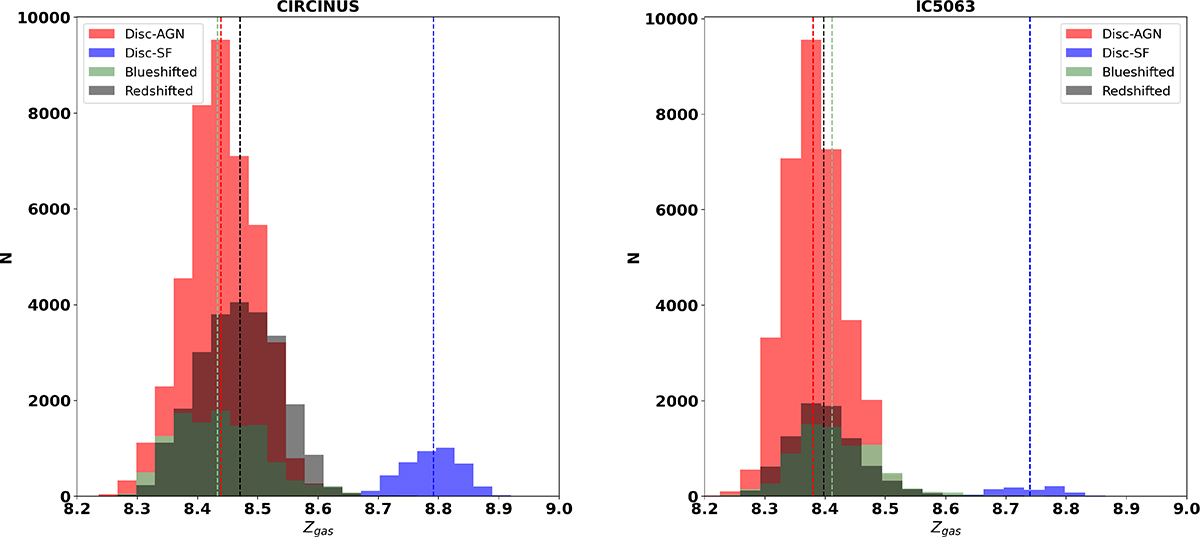
Fig. 2.
Download original image
Distribution of Zgas for the AGN parts in disc(red), redshifted (black) and blueshifted (green) outflow. SF-regions in disk is plotted in blue colour. The vertical dashed lines show the median value of Zgas for each of the components in the same colour. The Zgas for CIRCINUS, and IC 5063 are shown here while other galaxies are demonstrated in Appendix A.
Current usage metrics show cumulative count of Article Views (full-text article views including HTML views, PDF and ePub downloads, according to the available data) and Abstracts Views on Vision4Press platform.
Data correspond to usage on the plateform after 2015. The current usage metrics is available 48-96 hours after online publication and is updated daily on week days.
Initial download of the metrics may take a while.