| Issue |
A&A
Volume 703, November 2025
|
|
|---|---|---|
| Article Number | A161 | |
| Number of page(s) | 11 | |
| Section | Extragalactic astronomy | |
| DOI | https://doi.org/10.1051/0004-6361/202556731 | |
| Published online | 21 November 2025 | |
Negative gas-phase metallicity gradients in the narrow-line region and galactic disc of local galaxies hosting active galactic nuclei
1
Department of Physics, University of Arkansas, 226 Physics Building, 825 West Dickson Street, Fayetteville, AR 72701, USA
2
Instituto de Astrofísica de Canarias, E-38205 La Laguna, Tenerife, Spain
3
Departamento de Astrofísica, Universidad de La Laguna, E-38200 La Laguna, Tenerife, Spain
4
Department of Physics & Astronomy “Augusto Righi”, University of Bologna, via Gobetti 93/2, 40129 Bologna, Italy
5
INAF, Astrophysics and Space Science Observatory Bologna, Via P. Gobetti 93/3, I-40129 Bologna, Italy
⋆ Corresponding author: This email address is being protected from spambots. You need JavaScript enabled to view it.
Received:
4
August
2025
Accepted:
11
September
2025
Abstract
The gas-phase metallicity distribution in galaxies offers significant information on their evolution. We report the discovery of negative radial gradients in the gas-phase metallicity of the narrow-line region (NLR) of the nine galaxies in the Measuring Active Galactic Nuclei Under MUSE Microscope (MAGNUM) galaxies: Centaurus A, Circinus, IC 5063, NGC 1068, NGC 1365, NGC 1386, NGC 2992, NGC 4945, and NGC 5643. From the strong-line abundance relations for active galactic nuclei (AGNs) and star-forming regions, along with emission-line ratio diagnostics, we were able to determine spatially resolved gas-phase metallicities for the kinematic components, galaxy disc, and outflow. These relations involve sensitive strong emission lines, specifically [O III]λ5007, [N II]λ6584, Hα, Hβ, [S II]λ6716, and [S II]λ6731. The existence of predominantly negative radial metallicity gradients in these AGN host galaxies indicates that metals are not necessarily moved from the central regions to the outskirts by AGN activity. We find that the gas-phase metallicity in galaxies could follow the general inside-out star formation scenario.
Key words: evolution / ISM: general / HII regions / ISM: jets and outflows / ISM: structure
© The Authors 2025
 Open Access article, published by EDP Sciences, under the terms of the Creative Commons Attribution License (https://creativecommons.org/licenses/by/4.0), which permits unrestricted use, distribution, and reproduction in any medium, provided the original work is properly cited.
This article is published in open access under the Subscribe to Open model. This email address is being protected from spambots. You need JavaScript enabled to view it. to support open access publication.
1. Introduction
The gas-phase metallicity (Zgas) is a key tracer of chemical evolution in galaxies, providing crucial insights into the processes that regulate star formation, gas inflow+outflow, and feedback mechanisms in galaxies (e.g. Mayor 1976; Mayor & Vigroux 1981; Pagel 1979; Shaver et al. 1983; Moustakas et al. 2011; Cresci et al. 2012; Sommariva et al. 2012; Khoram et al. 2025). The radial gradient of Zgas provides critical information about the evolutionary history of the galaxy metal content. Typically, spiral galaxies exhibit a negative metallicity gradient, with a higher metal content in the central regions and lower metallicity at larger radii; namely, accretion begins in the centre of a galaxy and expands outwards Matteucci & Francois (1989). This trend is often interpreted in the context of an inside-out galaxy scenario (e.g. Samland et al. 1997; Portinari & Chiosi 1999; Boissier & Prantzos 2000; Pilkington et al. 2012; Maiolino & Mannucci 2019; Franchetto et al. 2020), where the central regions undergo more prolonged star formation and experience continuous metal enrichment. In this case, metals are produced in galaxies and returned to the inter stellar medium (ISM) through a variety of mechanisms, such as stellar winds from massive stars (e.g. Higgins et al. 2023), supernova explosions (Hillebrandt & Niemeyer 2000; Woosley et al. 2002), neutron star mergers (Thielemann et al. 2017), and the ejection of gas by asymptotic giant branch stars (e.g. van Winckel 2003).
Negative metallicity gradients, a common feature in the disks of most spiral galaxies, have been extensively studied (Kennicutt et al. 2003). Notably, three major surveys have substantially expanded the dataset for measuring metallicity gradients in the Local Universe: Calar Alto Legacy Integral Field Area (CALIFA) (Sánchez et al. 2012), Mapping nearby Galaxies at Apache Point Observatory (MaNGA) (Bundy et al. 2015), and Sydney-AAO Multi-Object Integral-field spectrograph (SAMI) (Bryant et al. 2015). The primarily results from these surveys indicate that metallicity gradients predominantly exhibit a negative trend in nearby galaxies (Mingozzi et al. 2020; Belfiore et al. 2017; Khoram & Belfiore 2025). Some studies have reported a distinct positive metallicity gradient, while others have found results to the contrary. (Cresci et al. 2010; Queyrel et al. 2012; Belfiore et al. 2017; Carton et al. 2018; Wang et al. 2019; Mingozzi et al. 2020; Simons et al. 2021).
According to the scenario proposed by Somerville & Davé (2015), galaxies evolve within a dense environment where gas circulates through, around, and within them. Each phase in this cycle, such as altered star formation, accretion processes, and mergers, exerts a unique influence on the galaxy evolution. The presence of positive metallicity gradients may indicate direct accretion of metal-poor gas into the central regions of galaxies, resulting in diluted central metallicities and a pronounced change in gradients at small galactocentric distances (Simons et al. 2021). Storchi-Bergmann & Schnorr-Müller (2019) demonstrated that the interaction with gas-rich dwarf galaxies can initiate nuclear activity in host galaxies, leading to the accretion of low-metallicity gas into the nuclear regions and leading to its dilution. Some studies of high-redshift star-forming (SF) galaxies, (e.g. Queyrel et al. 2012; Ju et al. 2025; Sun et al. 2025), observed positive metallicity gradients and suggested that environmental interactions may induce an inversion in metallicity gradients. In addition, Zgas gradients could also have a flat profile. Both active and non-active spiral galaxies can exhibit flat metallicity gradients in their disks, where the metallicity remains nearly constant across the radial extent of the galaxy (do Nascimento et al. 2022; Venturi et al. 2024). Such a distribution may indicate efficient metal mixing, likely driven by turbulence induced by AGN feedback (e.g. He et al. 2019, 2022; Übler et al. 2023), galactic-scale outflows (e.g. Gibson et al. 2013), or environmental interactions (Rich et al. 2012; Queyrel et al. 2012; Torres-Flores et al. 2013). Additionally, galaxies in dense environments, such as galaxy clusters, might experience enhanced mixing due to tidal interactions and ram-pressure stripping, further contributing to the specific metallicity distribution (Franchetto et al. 2021; Khoram et al. 2024).
In AGN host galaxies, metallicity investigations help distinguish between the effects of AGN-driven feedback and star formation on the enrichment of the ISM. Overall, AGNs play a fundamental role in galaxy evolution by influencing gas dynamics through radiation pressure, outflows, and jets, which, in turn, impact the metal distribution within galaxies (e.g. Sánchez Almeida et al. 2014; Choi et al. 2020; Villar Martín et al. 2024; Amiri et al. 2024; Marconcini et al. 2025). Understanding how Zgas is distributed in AGN hosts is essential for constraining feedback mechanisms and their roles in modulating star formation and chemical enrichment. The enhanced metal enrichment attributed to AGN activity might result from mechanisms, as an the case of an in situ top-heavy initial mass function (IMF) in the accretion disk around the supermassive black hole (Nayakshin & Sunyaev 2005) or dust destruction in the broad line region (BLR), releasing metals into the ISM (Maiolino & Mannucci 2019). This suggests that AGNs can trigger rapid star formation and enrich the ISM.
Optical emission line studies have frequently revealed the presence of ionised gas outflows, particularly in the narrow-line regions (NLRs) and extended NLRs, providing vital insights into the AGN-host galaxy correlation (Veilleux & Osterbrock 1987; Unger et al. 1987; Pogge 1988). Resolved observations have enabled the detailed resolution of NLRs in nearby galaxies within close proximity to the supermassive black hole (SMBH), unravelling their extension over several kiloparsecs (kpc) into the bulges and/or disks of host galaxies (Kang & Woo 2018). The kinematic behaviour and physical properties of the ionised gas within the NLR yield crucial information on outflow characteristics, including the associated energy budgets (Bennert et al. 2006; Vaona et al. 2012; Dopita et al. 2002; Mingozzi et al. 2019; Chen et al. 2019; Zhang 2022; Meena et al. 2023). AGN-driven outflows ejecting high-metallicity gas from the BLR at kpc scales can further enrich the NLR, potentially through in situ star formation occurring within AGN-driven outflows (Maiolino et al. 2017; Gallagher et al. 2019; Amiri et al. 2024).
The primary purpose of this work is to determine whether AGN-driven outflows significantly impact Zgas gradients, by directly comparing the gradients in the discs and outflows of nearby Seyfert galaxies. Our main goal is to compare Zgas gradients in the discs and outflow components (redshifted and blueshifted) of nine AGN host galaxies to test whether AGN-driven outflows redistribute metals on galactic scales or whether the gradients remain similar to those in non-active spirals. This study also provides a modification over the analysis of do Nascimento et al. (2022), who measured metallicity gradients in MaNGA galaxies without explicitly accounting for the influence of outflows. The present study expands our previous one of an individual AGN (Amiri et al. 2024) by examining a more extensive, homogeneous sample from the MAGNUM survey and by directly distinguishing between disc and outflow kinematic components through the emission-line profile decomposition method proposed byMingozzi et al. (2019).
The paper is organised as follows. In Section 2, we provide a brief overview of the AGN sample which is used in our study. In Section 3, we outline how we classify the data into AGN and SF regions. In Section 4, we further detail the calibration relations to estimate the gas-phase metallicities. In Section 5, we demonstrate how gas-phase metallicities depend on the radial distance. Finally, in Section 6, we discuss our findings and summarise the implications and significance of our study.
2. Observational data
We examined the ISM characteristics of nine nearby Seyfert galaxies, all of which have noticeable outflows reported by Mingozzi et al. (2019) with the Measuring Active Galactic Nuclei Under MUSE Microscope (MAGNUM) survey. To select those galaxies, Mingozzi et al. (2019) cross-referenced the Swift-BAT 70-month Hard X-ray Survey (Baumgartner et al. 2013) with optically selected AGN samples from Maiolino & Rieke (1995) and Risaliti et al. (1999). The selection process focused on sources that could be observed from the Paranal Observatory and had a luminosity distance within 50 Mpc. Table 1 provides each galaxy’s primary features, and the following gives a brief description of each galaxy.
General information on MAGNUM galaxies.
2.1. Centaurus A:
Located at a distance 3.82 Mpc, Centaurus A is one of the closest Seyfert 2 galaxies. The MAGNUM survey detected ionised outflows with complex kinematics (Mingozzi et al. 2019), indicative of active interactions between the AGN and the surrounding ISM. Studies (e.g. Santoro et al. 2015, 2016; Mingozzi et al. 2019) have explored the host galaxy nuclear region, revealing intricate structures and dynamics associated with its active nucleus.
2.2. Circinus:
A nearby gas-rich Seyfert 2 galaxy at a distance of 4.2 Mpc with a spiral morphology. Matt et al. (2000) offered evidence of an obscured AGN via X-ray spectral analysis. A study by Kakkad et al. (2023) demonstrated the morphological features of ionised gas outflows in the Circinus galaxy using the MUSE in narrow field mode. Their analysis of the MUSE observations reveals a distinct collimated and clumpy outflow structure emerging near the nuclear region and extending up to approximately 30 pc in the northwest direction. This collimated configuration then transforms into two filamentary structures, resulting in an overall tuning-fork morphology of the outflow gas. Kakkad et al. (2023) suggested that the collimated structure itself could result from interactions between jets and the ISM on small scales.
2.3. IC 5063:
This early-type galaxy, approximately 45.3 Mpc away, exhibits Seyfert 2 characteristics. Since the radio plasma jet is expanding into a clumpy gaseous medium, it might be in the process of creating a cocoon of shocked gas that is pushed away from the jet axis, making this galaxy one of the most spectacular examples of jet-driven outflow, with similar features in the ionised, neutral atomic, and molecular phase (Morganti et al. 1998; Sharp & Bland-Hawthorn 2010; Tadhunter et al. 2014; Oosterloo et al. 2017; Venturi et al. 2021). Using JWST MIRI data of the nuclear region of IC 5063, Dasyra et al. (2024) demonstrated that an unidentified source at the galaxy nucleus emits a bright continuum that can be attributed to the torus, with a possible contribution from the radio core.
2.4. NGC 1068:
A barred spiral galaxy located approximately at 12.5 Mpc, NGC 1068 is one of the most studied Seyfert galaxies due to its proximity and brightness. Recent studies have revealed that low-power radio jets in NGC 1068 can drive significant turbulence in the ISM, leading to enhanced line widths perpendicular to the jets and indicating strong jet-ISM interactions (Venturi et al. 2021; Melso et al. 2024).
2.5. NGC 1365:
Known as the great barred spiral galaxy, Seyfert 1.8 NGC 1365 is located at 18.6 Mpc distance. The MAGNUM survey observed ionised gas outflows with complex kinematics, suggesting interactions between the AGN activity and the host galaxy ISM. The MUSE data of this source reveal a bi-conical AGN-ionised outflow extended on several kpc as well non-circular motions compatible with inflows along the galactic bar (Venturi et al. 2018; Schinnerer et al. 2023).
2.6. NGC 1386:
This spiral galaxy, approximately 15.6 Mpc away, hosts a Seyfert 2 nucleus. At a scale of a few parsecs from the centre, Rodríguez-Ardila et al. (2017) made a the direct measurement of powerful mass outflows traced by the forbidden high-ionization gas. They discovered two symmetrical expanding hot gas shells traveling in opposing directions along the line of sight (Mingozzi et al. 2019). The gas shells’ spatial correlation with X-rays and radio emission observed at the same parsec-scales indicates that this is a shock-driven outflow that was most likely caused by a newly formed core jet.
2.7. NGC 2992:
With a spiral morphology at a distance 31.5 Mpc, this galaxy contains a Seyfert 1.9 nucleus. Hα and O III emission and soft X-ray observations (e.g. Colina et al. 1987; Colbert et al. 1996; Veilleux et al. 2001) offer evidence of a broad biconical large-scale outflow that extends above and below the galaxy plane, which may be caused by AGN activity (Mingozzi et al. 2019; Friedrich et al. 2010). Luminari et al. (2023) suggested that the wind might drive feedback impacts between the AGN and the host galaxy by utilizing a combination of XMM-Newton and NuSTAR data.
2.8. NGC 4945:
This Seyfert 2 spiral galaxy located at 3.7 Mpc is well known for being one of the nearest objects where starburst and AGN activity overlap. The absence of UV photons relative to X-rays and the fact that the AGN presence is only confirmed by X-ray observations (e.g. Guainazzi et al. 2000) suggest either unusual activity or the complete obscured of its UV emission along all lines of sight (Marconi et al. 2000). Near- and mid-infrared spectroscopy, (Pérez-Beaupuits et al. 2011) reveals a prominent dust lane aligned along the major axis of the galactic disc, which is linked to the region’s very strong obscuration in the centre. The biconical outflow that characterises this galaxy is evident from the [NII] emission map (Venturi et al. 2017; Mingozzi et al. 2019; Marconcini et al. 2023).
2.9. NGC 5643:
A Seyfert 2 spiral galaxy located at 17.3 Mpc. The double-sided ionization cone was examined by Cresci et al. (2015) who found that it was an asymmetric, blueshifted wing of the O III emission line up to a projected velocity of ∼ − 450 km s−1, parallel to the low luminosity radio and X- ray jet, potentially collimated by a dusty structure around the nucleus. Additionally, in two star-forming clumps along the bar dust lane boundary (Silk 2013), Cresci et al. (2015) revealed evidence of positive feedback induced by outflowing gas. These clumps were also characterised by modest CO (2-1) emission (Alonso-Herrero et al. 2018).
In this work, we built upon the detailed study carried out by Mingozzi et al. (2019), who disentangled the emission associated with galaxy disks from that of ionised outflows based on a kinematic decomposition of the emission-line profiles. In the referenced work, the authors reduced the data by using the standard ESO pipeline, yielding datacubes with a spatial sampling of 0.2″ and a spectral resolution ranging from R ≈ 1750 to 3750 across the optical range. The analysis was performed with custom Python scripts. The stellar continuum was modeled via pPXF (Cappellari & Emsellem 2004), using single stellar population templates from Vazdekis et al. (2010) and applied to Voronoi-binned spaxels to ensure an average continuum S/N of 50 for λ < 5530 Å. In Seyfert 1 nuclei (NGC 1365 and NGC 2992), additional components were included to account for broad-line emission and AGN continuum. After subtracting the fitted continuum on a spaxel-by-spaxel basis, the emission lines ([O III]λλ4959,5007, [N II]λ6584, Hα, Hβ, [S II]λ6716, and [S II]λ6716, [O I]λλ6300,64) were fitted using MPFIT (Markwardt 2009), with one to four Gaussian components, depending on the complexity of the line profile. For NGC 1365, we used binned velocity fluxes due to its low S/N ratio, whereas we employed smoothed velocity bin fluxes for the other galaxies. Kinematics (velocity and dispersion) were tied across all lines in each component, while fluxes were left free, with fixed theoretical ratios for known doublets (for more details see Mingozzi et al. 2019). A reduced χ2 criterion was used to select the optimal number of components per spaxel. This approach allowed for a robust decomposition of the emission-line profiles, particularly in regions affected by non-Gaussian shapes, such as galaxy centres and ionised outflows.
In Section 3 of the analysis by Mingozzi et al. (2019), the authors presented a method for disentangling the physical properties of the ionised gas associated with galaxy disks from those of the outflowing gas. By exploiting the spatial and spectral resolution of MUSE data, they performed a kinematic decomposition of the emission-line profiles into velocity bins (see also Venturi et al. 2021). The velocity channels near the stellar velocity trace the rotating disk component, while the high-velocity wings, typically at ν > 150–250 km s−1, are attributed to the outflow (their Fig. 1; Table 2). This approach reveals that disk emission is generally associated with ring-like, spiral, or bar structures, whereas outflows usually appear as extended (bi)conical features on kiloparsec scales (their Fig. 2). The two kinematic components thus generally show distinct spatial distributions and different ISM properties (i.e. density, attenuation, ionization parameter, source of ionization, etc.), supporting a physical separation between rotating and outflowing gas. A comprehensive overview of the disparities between the disc and outflow gases for each of the nine galaxies under scrutiny is presented in Table 2, expressing crucial insights into their unique characteristics and dynamics.
MAGNUM galaxies components (all velocities are in [km s−1]).
3. AGN and star-forming region classification
To classify regions in the nine MAGNUM galaxies as AGN-ionised or H II-ionised, we used the standard Baldwin-Phillips-Terlevich (BPT) diagrams (Baldwin et al. 1981) applied to the analyzed spectral features of both disc and outflow components. The distribution of the bins in the [O III] 5007/Hβ versus [N II]6584/Hα diagram, along with the boundary lines between SF and AGN regions defined by Kewley et al. (2001) and Kauffmann et al. (2003), is shown in Fig. 1. The black demarcation line (Kewley et al. 2001) is a theoretical upper limit on the location of SF galaxies in this diagram, obtained using a combination of photoionisation and stellar population synthesis models. It yields a conservative selection of AGN-dominated regions. Kauffmann et al. (2003) revised this boundary line on the basis of observational evidence that SF regions and AGNs are distributed along two separate sequences. It yields a conservative SF region selection, which is shown in blue.
To avoid ambiguous classifications, we adopted the more conservative selection for both SF regions and AGNs, excluding the bins located between the two lines from further consideration. These could include regions with a mixture of ionising sources (e.g. Allen et al. 2008; Rosa et al. 2021), which are expected to have a mixed AGN-stellar emission as their ionising source (e.g. Davies et al. 2014). Figure 1, we give two examples; this is fully demonstrated in Appendix D of Mingozzi et al. (2019). Additionally, we excluded SF regions from the outflow, as our Zgas assessments indicate larger metallicities than those associated with the AGN components of the outflow. These might be parts of the disc that have been inaccurately classified inside the outflow due to inadequate disc-outflow separation. Moreover, this might imply that the areas are not exclusively ionised by SF as there is an AGN contribution to the line emission, making the metallicity calibrators for SF regions unsuitable in these particular components.
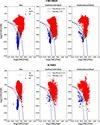 |
Fig. 1. BPT diagnostic diagram for Circinus and IC 5063 to distinguish between AGN and SF ionised regions. The solid black line and the solid blue line show the discrimination between the two populations according to the boundaries from Kewley et al. (2001) and Kauffmann et al. (2003), respectively. Blue stars and red circles mark AGN- and SF-dominated regions, respectively, while small gray dots demonstrate the entire set of spaxel data. |
4. Estimating the gas-phase metallicity
To estimate Zgas in each galaxy components, we use calibrations based on strong emission lines, commonly referred to as the ‘strong line method’. Computing element abundances using the direct method (Te) is not possible as the MUSE wavelength coverage does not include the main temperature-sensitive emission lines [O III]λ4363 and the doublet [O II]λλ3727,3730. Furthermore, [N II]λ5755 and [S III]λ6312 are undetectable due to their exceedingly low S/N ratio in the MAGNUM galaxies. Additionally, we cannot calculate Zgas from infrared nebular lines (Pérez-Díaz et al. 2022) without the observation of a hydrogen recombination line within the infrared range.
Recently, Marconi et al. (2024) established a new multi-cloud photoionisation approach (HOMERUN) to estimate Zgas based on observed emission lines. This is a distinctive approach that the current version of their code does not yet include AGN photoionisation models. We are aware of the systematic variations in Zgas that might occur when using strong line approaches, leading to differences of up to 0.6 dex for H II regions (e.g. Kewley & Ellison 2008; López-Sánchez et al. 2012; Peña-Guerrero et al. 2012) and up to 0.8 dex for AGNs when comparing metallicities obtained using the strong line method based on calibrations from different authors; particularly in the low-metallicity regime (less than 8.5, e.g. Dors et al. 2020). As discussed in detail in Armah et al. (2023), the different calibrations employ distinct emission line ratios that are sensitive to varying physical conditions, such as the ionisation parameter, gas density, and metallicity, leading to divergent gradient estimates.
To estimate Zgas using the strong line method, we utilised the emission line intensities of [O III]λ5007, [N II]λ6584, Hα, Hβ, [S II]λ6716, and [S II]λ6716. We considered S/N> 5 for each emission line. Bins with no detection of at least one of these emission lines were discarded. To estimate Zgas for regions dominated by AGN and SF, we considered two distinct calibration relations. For SF regions, we examined the O3N2 methodology by Alloin et al. (1979), which has been further developed by Pettini & Pagel (2004) and expressed as
 (1)
(1)
where O3N2 is defined as
![Mathematical equation: $$ \begin{aligned} \mathrm{{O3N2}}&= {([\mathrm{{O}}\,iii ]\lambda 5007/\mathrm{H}\beta )/ ([\mathrm{N}\,ii ]\lambda 6584/\mathrm{H}\alpha }). \end{aligned} $$](/articles/aa/full_html/2025/11/aa56731-25/aa56731-25-eq2.gif) (2)
(2)
We emphasise that the observations are not included in the data release. As a result, individual spaxels likely contain more than one H II region, and the metallicities presented here should be regarded as spatially averaged values rather than measurements of single H II regions.
To calculate Zgas in each spaxel containing AGN regions, we used the relation from Storchi-Bergmann et al. (1998). We first calculated Zgas from the optical emission-line ratios of AGN that are valid for Zgas in the range 8.4 ≤ Zgas ≤ 9.4. The values of Zgas computed from these calibrations vary by ∼0.1 dex. The metallicity value is corrected in order to take electron density (ne) effects into account via
 (3)
(3)
where we have
 (4)
(4)
In addition, N2, S2, and R3 are defined as
![Mathematical equation: $$ \begin{aligned}&\mathrm{N2} = {[\mathrm{N}\,ii ]\lambda 6584/\mathrm{H}\beta },\end{aligned} $$](/articles/aa/full_html/2025/11/aa56731-25/aa56731-25-eq5.gif) (5)
(5)
![Mathematical equation: $$ \begin{aligned}&\mathrm{S2} = ({[\mathrm{S}ii ]\lambda 6716+[\mathrm{S}ii ]\lambda 6730)/\mathrm{H}\beta },\end{aligned} $$](/articles/aa/full_html/2025/11/aa56731-25/aa56731-25-eq6.gif) (6)
(6)
![Mathematical equation: $$ \begin{aligned}&\mathrm{R3} = {[\mathrm{O}iii ]\lambda 5007/\mathrm{H}\beta }. \end{aligned} $$](/articles/aa/full_html/2025/11/aa56731-25/aa56731-25-eq7.gif) (7)
(7)
To estimate ne we assumed a temperature of Te = 104 K and measured the optical [S II]λ6716 /[S II]λ6731 ratio, converting it to an electron density using the Osterbrock & Ferland (2006) model via Pyneb (Luridiana et al. 2015). The results are shown in the Fig. 2 and Appendix A.
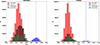 |
Fig. 2. Distribution of Zgas for the AGN parts in disc(red), redshifted (black) and blueshifted (green) outflow. SF-regions in disk is plotted in blue colour. The vertical dashed lines show the median value of Zgas for each of the components in the same colour. The Zgas for CIRCINUS, and IC 5063 are shown here while other galaxies are demonstrated in Appendix A. |
It is imperative to stress that this calibration relies on one-dimensional photoionization models. In the calibration of Storchi-Bergmann et al. (1998), as well as in similar approaches (e.g. Zhu et al. 2024), the ionising source is centralised, and computations are concluded over the nebular radius, anticipating emission line fluxes. This may provide higher uncertainties when deriving Zgas from spatially resolved observational data, but not from integrated data.
Radial Zgas trend.
5. Results
5.1. Radial variations of Zgas
We derived radial Zgas distribution based on strong line calibration relations. To calculate the variations in Zgas relative to the galactic centre, we estimated the projected distance from the [O III]λ5007 emission spatial peak. We defined the [O III]λ5007 peak as the galaxy centre by determining the pixel with the largest flux, subsequently calculating the projected distance of each pixel from this centre using the Euclidean distance scaled by the pixel size. We derived the radial oxygen abundance profiles for the disc, redshifted outflow, and blueshifted outflow components of MAGNUM galaxies, as shown in Figs. 3, B.1, B.2, and B.3. We employed a binned linear regression approach to fit the radially averaged Zgas as a function of radial distance. In Table 3, we list the radial Zgas behaviour for each galaxy component. Our main redshifted and blueshifted outflows demonstrates no particular variation from the negative radial Zgas gradients observed in non-active galaxies, suggesting that AGN feedback does not predominantly lead the redistribution of metals on galactic scales. This aligns with earlier studies indicating that AGN-driven outflows tend to be collimated, anisotropic, and episodic; hence their ability to homogenise the chemical composition of the ISM is limitd (e.g. Harrison 2018; Venturi et al. 2021). The observed gradients are more effectively explained by an inside-out evolution model, wherein earlier and sustained star formation in the central regions results in elevated metallicities compared to the outskirts (e.g. Pérez et al. 2013; Sánchez et al. 2014). The results indicate that, for mainly redshifted and blueshifted outflows, the impact of AGN feedback on radial Zgas might not be the main reason behind the redistribution of the metal contents. We found that the negative trend in the radial Zgas in both redshifted and blueshifted outflows in the MAGNUM survey is incapable of redistributing centrally enriched material to the outer regions of their host galaxies. The kinetic power of these outflow components is inadequate with respect to displacing the metals from the central area. This is reflected in the observed steep negative radial metallicity gradients, with no compelling evidence of chemical enrichment beyond the inner regions. Similar conclusions have been drawn in recent integral field spectroscopic studies, which demonstrate that while outflows can perturb the circumnuclear interstellar medium, they typically do not possess the energy required to drive any galaxy-scale transport of metals (e.g. Venturi et al. 2018; Mingozzi et al. 2019). This finding is also supported by studies of more extreme systems: in the ultraluminous infrared galaxies (ULIRGs), outflows show greater mechanical output and can contribute to chemical enrichment beyond the disk (Rupke et al. 2005). Simulations further indicate that only high-luminosity AGN can launch outflows capable of varying metallicity profiles on large scales (e.g. Nelson et al. 2019). Therefore, in these low-luminosity AGNs, the feedback appears spatially limited and chemically ineffective at the scale of the entire galaxy.
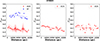 |
Fig. 3. IC 5063 metallicity gradient profiles for disc (left column), redshifted (middle column), and blueshifted (right column) outflow of MAGNUM galaxies using the Storchi-Bergmann et al. (1998) and Pettini & Pagel (2004) metallicity relations for AGNs (red circles) and SF regions (blue circles), respectively, with the radius (in pc) given on the bottom axis. Overplotted are binned linear fits to the radial metallicity gradient in AGNs (dotted red lines) and SF regions (dotted blue lines). The bigger dots mark the binned median values, and error bars represent the scatter in the data within each bin. |
Additionally, blueshifted outflow regions of Circinus and NGC 5643 also have a positive radial Zgas. Several nearby AGNs have been shown to exhibit positive gradients, such as NGC 7130 (Amiri et al. 2024) and around 20 percent of the Seyfert galaxies from the SDSS-IV MaNGA survey (do Nascimento et al. 2022). NGC 1365 is the only galaxy in the MAGNUM survey whose redshifted and blueshifted outflow components, as well as its disc AGN component, exhibit a positive radial gradient in Zgas, as shown in Fig. B.2.
Table 1 highlighted that NGC 1365, Circinus, and NGC 5643 show also no evidence of interactions with their nearby galaxies. In such a case, metal-enriched outflows may transport heavy elements from the central regions to the outskirts of the galaxy through the absence of external environmental influence. Given the substantial energy required to transport this gas to its observed position, AGN-driven physical properties are considered the most plausible mechanism for such metal content displacement (e.g. Simionescu et al. 2008; Pope et al. 2010; Kirkpatrick et al. 2011). This is aligned with the observational evidence supporting the presence of metal-rich outflows driven by AGN-powered winds and/or jets (McNamara & Nulsen 2012; Amiri et al. 2024).
Interpreting the ionisation sources within galactic discs is more complicated because those regions are often ionised by both AGNs and SF. The AGN radiation can ionise parts of the disc, especially if the AGN outflow axis is aligned close to the disc plane. However, one alternative is that some regions identified as AGN-ionised are actually outflow components that were misclassified as disc components due to limitations in kinematic analysis, in particular, the difficulties related to accurately measuring the intensity of the [O III] line associated with the disc. Regions of the disc ionised by an AGN typically show a positive radial gradient in Zgas. By contrast, SF and AGN regions within the disc exhibit a negative radial Zgas gradient in 60 per cent, while 40 per cent of our AGN-ionised disc regions also show this negative trend. This negative gradient in the disc aligns with the idea that galaxies have relatively uniform gas accretion histories, where metal-poor inflows and outflows primarily influence the outer parts of galaxies. This, combined with the inside-out evolution of galaxies, naturally leads to a negative metallicity gradient (e.g. Boardman et al. 2023). Conversely, in simpler scenarios where galaxies form and evolve in dense environments with significant gas flows (e.g. Somerville & Davé 2015), the radial Zgas gradient can be inverted (positive). Consequently, the combination of these scenarios can provide a dual behaviour (positive and negative) for radial Zgas in the disk.
6. Discussion and conclusions
We investigated the unresolved issue of the radial distribution of gas-phase metallicities in AGNs by exploring the disc and outflow gas components discovered in the MAGNUM survey by Mingozzi et al. (2019). We differentiated between SF- and AGN-dominated regions by using the conventional BPT diagnostics. Depending on the type of emission lines that may be detected in both AGN and SF regions, many studies have proposed varying strong line ratios to characterise the metallicities (e.g. Carvalho et al. 2020; Storchi-Bergmann et al. 1998; Pérez-Montero & Contini 2009; Curti et al. 2017). Depending on the location in the BPT diagram, we were able to compute gas-phase metallicities based on either the Storchi-Bergmann et al. (1998) and Pettini & Pagel (2004) calibration relations. We subsequently analysed the radial distribution of gas-phase metallicity for disc and redshifted and blueshifted outflows.
In the outflow (redshifted and blueshifted) regions, we discovered a predominantly negative radial trend, indicating a decrease in Zgas through the outer regions. This indicates that the total radial Zgas follows an inside-out scenario. Our analysis reveals that ionised outflows (both redshifted and blueshifted) in MAGNUM galaxies do not carry sufficient energy to drive metal-rich material from the nuclear regions to the outskirts of their host galaxies. The persistence of steep negative radial metallicity gradients suggest that such outflows are ineffective for chemical redistribution. This supports a picture in which AGN-driven feedback in typical Seyfert galaxies is confined to the central regions and does not significantly impact the chemical evolution of the outskirts of a galaxy. These results are aligned with both observational (e.g. Venturi et al. 2018; Mingozzi et al. 2019) and numerical simulation (e.g. Nelson et al. 2019) studies that stand in contrast to with findings in more energetic environments such as ULIRGs (Rupke et al. 2005), where outflows can influence the circumgalactic medium.
We also observe a dual behaviour in the disc component of both AGN- and SF-dominated regions, showing both positive and negative metallicity gradients. The negative trend corresponds to the notion that galaxies possess generally consistent gas accretion histories, where metal-poor inflows and outflows predominantly affect their outer regions. This aspect, combined with the inside-out evolution of galaxies (where central regions form stars and chemically enrich earlier than the outskirts), inevitably results in the emergence of a negative metallicity gradient (Boardman et al. 2023). This scenario also supports efficient metal dilution, consistent with a closed galaxy evolution system (Tissera et al. 2022). Conversely, positive radial Zgas gradients can emerge in models where galaxies form and evolve within dense environments. In such environments, gas circulates dynamically through, around, and within galaxies (Somerville & Davé 2015), potentially inverting the typical negative gradient.
The presence of this dualistic behaviour in disc metallicity gradients indicates that these physical ionised properties are not completely led by a single mechanism in galaxy evolution. A negative gradient can be driven primarily by the inside-out formation of galaxies and the continuous accretion of metal-poor gas from the cosmic web, which dilutes metals more effectively in the outer regions. This is further supported by models such as those of Tissera et al. (2022) concerning efficient metal dilution in galaxy evolution. Conversely, the presence of a positive gradient hints towards the effect of environmental influences and gas movements inside galactic halos (Somerville & Davé 2015). Therefore, the observed dual behaviour is a strong indicator that galaxy evolution is a nuanced process, shaped by both the internal evolutionary track and external environmental interactions.
In conclusion, our findings point to a limited role of Seyfert-driven outflows in shaping the metallicity redistribution on the galaxy. This could show that the outflows are not effective in displacing enriched material over large spatial scales. To investigate the role of outflows in redistributing metal contents, higher resolution observations are essential to detect outflows with more details on its physical properties, such as the total mass of the ionised gas, peak mass outflow rate, and total momentum. Such data would enable a more fundamental analysis of whether metal enrichment in the circumgalactic or ISM is primarily driven by outflow processes or whether environmental factors and secular evolution have a more critical impact on the distribution of metal content within galaxies.
Acknowledgments
We express our gratitude to the referee for improving this paper through their valuable suggestions. A.A. thanks Alessandro Marconi, Giacomo Venturi, Matilde Mingozzi, and Giovanni Cresci for helpful discussions. Co-funded by the European Union (MSCA Doctoral Network EDUCADO, GA 101119830 and Widening Participation, ExGal-Twin, GA 101158446). JHK acknowledges grant PID2022-136505NB-I00 funded by MCIN/AEI/10.13039/501100011033 and EU, ERDF.
References
- Allen, M. G., Groves, B. A., Dopita, M. A., Sutherland, R. S., & Kewley, L. J. 2008, ApJS, 178, 20 [Google Scholar]
- Alloin, D., Collin-Souffrin, S., Joly, M., & Vigroux, L. 1979, A&A, 78, 200 [Google Scholar]
- Alonso-Herrero, A., Pereira-Santaella, M., García-Burillo, S., et al. 2018, ApJ, 859, 144 [Google Scholar]
- Amiri, A., Knapen, J. H., Comerón, S., Marconi, A., & Lehmer, B. D. 2024, A&A, 689, A193 [NASA ADS] [CrossRef] [EDP Sciences] [Google Scholar]
- Armah, M., Riffel, R., Dors, O. L., et al. 2023, MNRAS, 520, 1687 [NASA ADS] [CrossRef] [Google Scholar]
- Baldwin, J. A., Phillips, M. M., & Terlevich, R. 1981, PASP, 93, 5 [Google Scholar]
- Baumgartner, W. H., Tueller, J., Markwardt, C. B., et al. 2013, ApJS, 207, 19 [Google Scholar]
- Belfiore, F., Maiolino, R., Tremonti, C., et al. 2017, MNRAS, 469, 151 [Google Scholar]
- Bennert, N., Jungwiert, B., Komossa, S., Haas, M., & Chini, R. 2006, A&A, 456, 953 [NASA ADS] [CrossRef] [EDP Sciences] [Google Scholar]
- Boardman, N., Wild, V., Heckman, T., et al. 2023, MNRAS, 520, 4301 [NASA ADS] [CrossRef] [Google Scholar]
- Boissier, S., & Prantzos, N. 2000, MNRAS, 312, 398 [Google Scholar]
- Bryant, J. J., Owers, M. S., Robotham, A. S. G., et al. 2015, MNRAS, 447, 2857 [Google Scholar]
- Bundy, K., Bershady, M. A., Law, D. R., et al. 2015, ApJ, 798, 7 [Google Scholar]
- Cappellari, M., & Emsellem, E. 2004, PASP, 116, 138 [Google Scholar]
- Carton, D., Brinchmann, J., Contini, T., et al. 2018, MNRAS, 478, 4293 [NASA ADS] [CrossRef] [Google Scholar]
- Carvalho, S. P., Dors, O. L., Cardaci, M. V., et al. 2020, MNRAS, 492, 5675 [NASA ADS] [CrossRef] [Google Scholar]
- Chen, J., Shi, Y., Dempsey, R., et al. 2019, MNRAS, 489, 855 [CrossRef] [Google Scholar]
- Choi, E., Brennan, R., Somerville, R. S., et al. 2020, ApJ, 904, 8 [NASA ADS] [CrossRef] [Google Scholar]
- Colbert, E. J. M., Baum, S. A., Gallimore, J. F., O’Dea, C. P., & Christensen, J. A. 1996, ApJ, 467, 551 [NASA ADS] [CrossRef] [Google Scholar]
- Colina, L., Fricke, K. J., Kollatschny, W., & Perryman, M. A. C. 1987, A&A, 178, 51 [NASA ADS] [Google Scholar]
- Colina, L., Sparks, W. B., & Macchetto, F. 1991, ApJ, 370, 102 [Google Scholar]
- Cresci, G., Mannucci, F., Maiolino, R., et al. 2010, Nature, 467, 811 [Google Scholar]
- Cresci, G., Mannucci, F., Sommariva, V., et al. 2012, MNRAS, 421, 262 [NASA ADS] [Google Scholar]
- Cresci, G., Marconi, A., Zibetti, S., et al. 2015, A&A, 582, A63 [NASA ADS] [CrossRef] [EDP Sciences] [Google Scholar]
- Curti, M., Cresci, G., Mannucci, F., et al. 2017, MNRAS, 465, 1384 [Google Scholar]
- Dasyra, K. M., Paraschos, G. F., Combes, F., et al. 2024, ApJ, 977, 156 [Google Scholar]
- Davies, R. L., Rich, J. A., Kewley, L. J., & Dopita, M. A. 2014, MNRAS, 439, 3835 [Google Scholar]
- Davis, B. L., Graham, A. W., & Seigar, M. S. 2017, MNRAS, 471, 2187 [Google Scholar]
- do Nascimento, J. C., Dors, O. L., Storchi-Bergmann, T., et al. 2022, MNRAS, 513, 807 [CrossRef] [Google Scholar]
- Dopita, M. A., Pereira, M., Kewley, L. J., & Capaccioli, M. 2002, ApJS, 143, 47 [NASA ADS] [CrossRef] [Google Scholar]
- Dors, O. L., Freitas-Lemes, P., Amôres, E. B., et al. 2020, MNRAS, 492, 468 [NASA ADS] [CrossRef] [Google Scholar]
- Franchetto, A., Vulcani, B., Poggianti, B. M., et al. 2020, ApJ, 895, 106 [NASA ADS] [CrossRef] [Google Scholar]
- Franchetto, A., Tonnesen, S., Poggianti, B. M., et al. 2021, ApJ, 922, L6 [NASA ADS] [CrossRef] [Google Scholar]
- Friedrich, S., Davies, R. I., Hicks, E. K. S., et al. 2010, A&A, 519, A79 [NASA ADS] [CrossRef] [EDP Sciences] [Google Scholar]
- Gallagher, R., Maiolino, R., Belfiore, F., et al. 2019, MNRAS, 485, 3409 [NASA ADS] [CrossRef] [Google Scholar]
- Gibson, B. K., Pilkington, K., Brook, C. B., Stinson, G. S., & Bailin, J. 2013, A&A, 554, A47 [CrossRef] [EDP Sciences] [Google Scholar]
- Goulding, A. D., Alexander, D. M., Lehmer, B. D., & Mullaney, J. R. 2010, MNRAS, 406, 597 [NASA ADS] [CrossRef] [Google Scholar]
- Guainazzi, M., Matt, G., Brandt, W. N., et al. 2000, A&A, 356, 463 [NASA ADS] [Google Scholar]
- Guolo-Pereira, M., Ruschel-Dutra, D., Storchi-Bergmann, T., et al. 2021, MNRAS, 502, 3618 [NASA ADS] [CrossRef] [Google Scholar]
- Harrison, C. M. 2018, Nat. Astron., 2, 198 [NASA ADS] [CrossRef] [Google Scholar]
- He, Z., Wang, T., Liu, G., et al. 2019, Nat. Astron., 3, 265 [NASA ADS] [CrossRef] [Google Scholar]
- He, Z., Liu, G., Wang, T., et al. 2022, Sci. Adv., 8, eabk3291 [NASA ADS] [CrossRef] [Google Scholar]
- Higgins, E. R., Vink, J. S., Hirschi, R., Laird, A. M., & Sabhahit, G. N. 2023, MNRAS, 526, 534 [NASA ADS] [CrossRef] [Google Scholar]
- Hillebrandt, W., & Niemeyer, J. C. 2000, ARA&A, 38, 191 [Google Scholar]
- Ju, M., Wang, X., Jones, T., et al. 2025, ApJ, 978, L39 [Google Scholar]
- Kakkad, D., Stalevski, M., Kishimoto, M., et al. 2023, MNRAS, 519, 5324 [Google Scholar]
- Kang, D., & Woo, J.-H. 2018, ApJ, 864, 124 [NASA ADS] [CrossRef] [Google Scholar]
- Kauffmann, G., Heckman, T. M., White, S. D. M., et al. 2003, MNRAS, 341, 33 [Google Scholar]
- Kennicutt, R. C., Jr, Armus, L., Bendo, G., et al. 2003, PASP, 115, 928 [NASA ADS] [CrossRef] [Google Scholar]
- Kewley, L. J., & Ellison, S. L. 2008, ApJ, 681, 1183 [Google Scholar]
- Kewley, L. J., Dopita, M. A., Sutherland, R. S., Heisler, C. A., & Trevena, J. 2001, ApJ, 556, 121 [Google Scholar]
- Khoram, A. H., & Belfiore, F. 2025, A&A, 693, A150 [NASA ADS] [CrossRef] [EDP Sciences] [Google Scholar]
- Khoram, A., Poggianti, B., Moretti, A., et al. 2024, A&A, 686, A261 [NASA ADS] [CrossRef] [EDP Sciences] [Google Scholar]
- Khoram, A. H., Poggianti, B., Moretti, A., et al. 2025, MNRAS, 540, L58 [Google Scholar]
- Kirkpatrick, C. C., McNamara, B. R., & Cavagnolo, K. W. 2011, ApJ, 731, L23 [NASA ADS] [CrossRef] [Google Scholar]
- Koss, M., Trakhtenbrot, B., Ricci, C., et al. 2017, ApJ, 850, 74 [Google Scholar]
- López-Sánchez, Á. R., Dopita, M. A., Kewley, L. J., et al. 2012, MNRAS, 426, 2630 [CrossRef] [Google Scholar]
- Luminari, A., Marinucci, A., Bianchi, S., et al. 2023, ApJ, 950, 160 [NASA ADS] [CrossRef] [Google Scholar]
- Luridiana, V., Morisset, C., & Shaw, R. A. 2015, A&A, 573, A42 [NASA ADS] [CrossRef] [EDP Sciences] [Google Scholar]
- Maiolino, R., & Mannucci, F. 2019, A&A Rev., 27, 3 [NASA ADS] [CrossRef] [Google Scholar]
- Maiolino, R., & Rieke, G. H. 1995, ApJ, 454, 95 [Google Scholar]
- Maiolino, R., Russell, H. R., Fabian, A. C., et al. 2017, Nature, 544, 202 [Google Scholar]
- Marconcini, C., Marconi, A., Cresci, G., et al. 2023, A&A, 677, A58 [NASA ADS] [CrossRef] [EDP Sciences] [Google Scholar]
- Marconcini, C., Feltre, A., Lamperti, I., et al. 2025, A&A, 701, A113 [NASA ADS] [CrossRef] [EDP Sciences] [Google Scholar]
- Marconi, A., Oliva, E., van der Werf, P. P., et al. 2000, A&A, 357, 24 [NASA ADS] [Google Scholar]
- Marconi, A., Pastorini, G., Pacini, F., et al. 2006, A&A, 448, 921 [NASA ADS] [CrossRef] [EDP Sciences] [Google Scholar]
- Marconi, A., Amiri, A., Feltre, A., et al. 2024, A&A, 689, A78 [NASA ADS] [CrossRef] [EDP Sciences] [Google Scholar]
- Markwardt, C. B. 2009, in Astronomical Data Analysis Software and Systems XVIII, eds. D. A. Bohlender, D. Durand, & P. Dowler, ASP Conf. Ser., 411, 251 [Google Scholar]
- Matt, G., Fabian, A. C., Guainazzi, M., et al. 2000, MNRAS, 318, 173 [NASA ADS] [CrossRef] [Google Scholar]
- Matteucci, F., & Francois, P. 1989, MNRAS, 239, 885 [Google Scholar]
- Mayor, M. 1976, A&A, 48, 301 [NASA ADS] [Google Scholar]
- Mayor, M., & Vigroux, L. 1981, A&A, 98, 1 [NASA ADS] [Google Scholar]
- McNamara, B. R., & Nulsen, P. E. J. 2012, New J. Phys., 14, 055023 [NASA ADS] [CrossRef] [Google Scholar]
- Meena, B., Crenshaw, D. M., Schmitt, H. R., et al. 2023, ApJ, 943, 98 [NASA ADS] [CrossRef] [Google Scholar]
- Melso, N., Schiminovich, D., Sitaram, M., et al. 2024, ApJ, 974, 161 [Google Scholar]
- Mingozzi, M., Cresci, G., Venturi, G., et al. 2019, A&A, 622, A146 [NASA ADS] [CrossRef] [EDP Sciences] [Google Scholar]
- Mingozzi, M., Belfiore, F., Cresci, G., et al. 2020, A&A, 636, A42 [NASA ADS] [CrossRef] [EDP Sciences] [Google Scholar]
- Morganti, R., Oosterloo, T., & Tsvetanov, Z. 1998, AJ, 115, 915 [NASA ADS] [CrossRef] [Google Scholar]
- Moustakas, J., Zaritsky, D., Brown, M., et al. 2011, arXiv e-prints [arXiv:1112.3300] [Google Scholar]
- Nayakshin, S., & Sunyaev, R. 2005, MNRAS, 364, L23 [CrossRef] [Google Scholar]
- Nelson, D., Pillepich, A., Springel, V., et al. 2019, MNRAS, 490, 3234 [Google Scholar]
- Oosterloo, T., Raymond Oonk, J. B., Morganti, R., et al. 2017, A&A, 608, A38 [NASA ADS] [CrossRef] [EDP Sciences] [Google Scholar]
- Osterbrock, D. E., & Ferland, G. J. 2006, Astrophysics of Gaseous Nebulae and Active Galactic Nuclei (Sausalito, CA: University Science Books) [Google Scholar]
- Pagel, B. E. J. 1979, in Stars and star systems, ed. B. E. Westerlund, Astrophys. Space Sci. Lib., 75, 17 [Google Scholar]
- Peña-Guerrero, M. A., Peimbert, A., & Peimbert, M. 2012, ApJ, 756, L14 [CrossRef] [Google Scholar]
- Pérez, E., Cid Fernandes, R., González Delgado, R. M., et al. 2013, ApJ, 764, L1 [Google Scholar]
- Pérez-Beaupuits, J. P., Spoon, H. W. W., Spaans, M., & Smith, J. D. 2011, A&A, 533, A56 [NASA ADS] [CrossRef] [EDP Sciences] [Google Scholar]
- Pérez-Díaz, B., Pérez-Montero, E., Fernández-Ontiveros, J. A., & Vílchez, J. M. 2022, A&A, 666, A115 [NASA ADS] [CrossRef] [EDP Sciences] [Google Scholar]
- Pérez-Montero, E., & Contini, T. 2009, MNRAS, 398, 949 [CrossRef] [Google Scholar]
- Pettini, M., & Pagel, B. E. J. 2004, MNRAS, 348, L59 [NASA ADS] [CrossRef] [Google Scholar]
- Pilkington, K., Few, C. G., Gibson, B. K., et al. 2012, A&A, 540, A56 [NASA ADS] [CrossRef] [EDP Sciences] [Google Scholar]
- Pogge, R. W. 1988, ApJ, 328, 519 [NASA ADS] [CrossRef] [Google Scholar]
- Pope, E. C. D., Babul, A., Pavlovski, G., Bower, R. G., & Dotter, A. 2010, MNRAS, 406, 2023 [NASA ADS] [Google Scholar]
- Portinari, L., & Chiosi, C. 1999, A&A, 350, 827 [NASA ADS] [Google Scholar]
- Queyrel, J., Contini, T., Kissler-Patig, M., et al. 2012, A&A, 539, A93 [NASA ADS] [CrossRef] [EDP Sciences] [Google Scholar]
- Rich, J. A., Torrey, P., Kewley, L. J., Dopita, M. A., & Rupke, D. S. N. 2012, ApJ, 753, 5 [NASA ADS] [CrossRef] [Google Scholar]
- Risaliti, G., Maiolino, R., & Salvati, M. 1999, ApJ, 522, 157 [Google Scholar]
- Rodríguez-Ardila, A., Prieto, M. A., Mazzalay, X., et al. 2017, MNRAS, 470, 2845 [Google Scholar]
- Rosa, D. A., Rodrigues, I., Krabbe, A. C., Milone, A. C., & Carvalho, S. 2021, MNRAS, 501, 3750 [NASA ADS] [CrossRef] [Google Scholar]
- Rupke, D. S., Veilleux, S., & Sanders, D. B. 2005, ApJS, 160, 115 [Google Scholar]
- Samland, M., Hensler, G., & Theis, C. 1997, ApJ, 476, 544 [NASA ADS] [CrossRef] [Google Scholar]
- Sánchez Almeida, J., Morales-Luis, A. B., Muñoz-Tuñón, C., et al. 2014, ApJ, 783, 45 [Google Scholar]
- Sánchez, S. F., Kennicutt, R. C., Gil de Paz, A., et al. 2012, A&A, 538, A8 [Google Scholar]
- Sánchez, S. F., Rosales-Ortega, F. F., Iglesias-Páramo, J., et al. 2014, A&A, 563, A49 [CrossRef] [EDP Sciences] [Google Scholar]
- Santoro, F., Oonk, J. B. R., Morganti, R., & Oosterloo, T. 2015, A&A, 574, A89 [NASA ADS] [CrossRef] [EDP Sciences] [Google Scholar]
- Santoro, F., Oonk, J. B. R., Morganti, R., Oosterloo, T. A., & Tadhunter, C. 2016, A&A, 590, A37 [NASA ADS] [CrossRef] [EDP Sciences] [Google Scholar]
- Schinnerer, E., Emsellem, E., Henshaw, J. D., et al. 2023, ApJ, 944, L15 [NASA ADS] [CrossRef] [Google Scholar]
- Sharp, R. G., & Bland-Hawthorn, J. 2010, ApJ, 711, 818 [Google Scholar]
- Shaver, P. A., McGee, R. X., Newton, L. M., Danks, A. C., & Pottasch, S. R. 1983, MNRAS, 204, 53 [NASA ADS] [CrossRef] [Google Scholar]
- Silk, J. 2013, ApJ, 772, 112 [Google Scholar]
- Simionescu, A., Werner, N., Finoguenov, A., Böhringer, H., & Brüggen, M. 2008, A&A, 482, 97 [NASA ADS] [CrossRef] [EDP Sciences] [Google Scholar]
- Simons, R. C., Papovich, C., Momcheva, I., et al. 2021, ApJ, 923, 203 [NASA ADS] [CrossRef] [Google Scholar]
- Somerville, R. S., & Davé, R. 2015, ARA&A, 53, 51 [Google Scholar]
- Sommariva, V., Mannucci, F., Cresci, G., et al. 2012, A&A, 539, A136 [NASA ADS] [CrossRef] [EDP Sciences] [Google Scholar]
- Storchi-Bergmann, T., & Schnorr-Müller, A. 2019, Nat. Astron., 3, 48 [Google Scholar]
- Storchi-Bergmann, T., Schmitt, H. R., Calzetti, D., & Kinney, A. L. 1998, ApJ, 115, 909 [Google Scholar]
- Sun, X., Wang, X., Ma, X., et al. 2025, ApJ, 986, 179 [Google Scholar]
- Tadhunter, C., Morganti, R., Rose, M., Oonk, J. B. R., & Oosterloo, T. 2014, Nature, 511, 440 [Google Scholar]
- Tanaka, I., Yagi, M., & Taniguchi, Y. 2017, PASJ, 69, 90 [NASA ADS] [Google Scholar]
- Thielemann, F.-K., Eichler, M., Panov, I., & Wehmeyer, B. 2017, Ann. Rev. Nucl. Part. Sci., 67, 253 [NASA ADS] [CrossRef] [Google Scholar]
- Tissera, P. B., Rosas-Guevara, Y., Sillero, E., et al. 2022, MNRAS, 511, 1667 [CrossRef] [Google Scholar]
- Torres-Flores, S., Scarano, S., Mendes de Oliveira, C., et al. 2013, MNRAS, 438, 1894 [Google Scholar]
- Übler, H., Maiolino, R., Curtis-Lake, E., et al. 2023, A&A, 677, A145 [NASA ADS] [CrossRef] [EDP Sciences] [Google Scholar]
- Unger, S. W., Pedlar, A., Axon, D. J., et al. 1987, MNRAS, 228, 671 [NASA ADS] [CrossRef] [Google Scholar]
- van Winckel, H. 2003, ARA&A, 41, 391 [Google Scholar]
- Vaona, L., Ciroi, S., Di Mille, F., et al. 2012, MNRAS, 427, 1266 [NASA ADS] [CrossRef] [Google Scholar]
- Vazdekis, A., Sánchez-Blázquez, P., Falcón-Barroso, J., et al. 2010, MNRAS, 404, 1639 [NASA ADS] [Google Scholar]
- Veilleux, S., & Osterbrock, D. E. 1987, ApJS, 63, 295 [Google Scholar]
- Veilleux, S., Shopbell, P. L., & Miller, S. T. 2001, AJ, 121, 198 [NASA ADS] [CrossRef] [Google Scholar]
- Venturi, G., Marconi, A., Mingozzi, M., et al. 2017, Front. Astron. Space Sci., 4, 46 [Google Scholar]
- Venturi, G., Nardini, E., Marconi, A., et al. 2018, A&A, 619, A74 [NASA ADS] [CrossRef] [EDP Sciences] [Google Scholar]
- Venturi, G., Cresci, G., Marconi, A., et al. 2021, A&A, 648, A17 [NASA ADS] [CrossRef] [EDP Sciences] [Google Scholar]
- Venturi, G., Carniani, S., Parlanti, E., et al. 2024, A&A, 691, A19 [NASA ADS] [CrossRef] [EDP Sciences] [Google Scholar]
- Villar Martín, M., López Cobá, C., Cazzoli, S., Pérez Montero, E., & Cabrera Lavers, A. 2024, A&A, 690, A397 [Google Scholar]
- Wang, X., Jones, T. A., Treu, T., et al. 2019, ApJ, 882, 94 [Google Scholar]
- Wang, J., Hammer, F., Rejkuba, M., Crnojevic, D., & Yang, Y. 2020, MNRAS, 498, 2766 [NASA ADS] [CrossRef] [Google Scholar]
- Woo, J.-H., & Urry, C. M. 2002, ApJ, 579, 530 [NASA ADS] [CrossRef] [Google Scholar]
- Woosley, S. E., Heger, A., & Weaver, T. A. 2002, Rev. Mod. Phys., 74, 1015 [NASA ADS] [CrossRef] [Google Scholar]
- Zhang, X. 2022, ApJS, 260, 31 [NASA ADS] [CrossRef] [Google Scholar]
- Zhu, P., Kewley, L. J., & Sutherland, R. S. 2024, ApJ, 977, 187 [Google Scholar]
Appendix A: the Zgas histogram
The distribution of Zgas in CENTAURUS A, NGC 1068, NGC 1365, NGC 1386, NGC 2992, NGC 4945, and NGC 5643 are shown in Fig A.1, as described in Sec. 4. We consider the Storchi-Bergmann et al. (1998) and Pettini & Pagel (2004) calibration relations to compute Zgas for AGNs and SF regions, respectively.
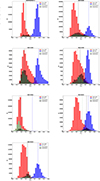 |
Fig. A.1. Distribution of Zgas in CENTAURUS A, NGC 1068, NGC 1365, NGC 1386, NGC 2992, NGC 4945, and NGC 5643. The AGN parts are shown in disc (red), redshifted (black), and blueshifted (green) outflow components while the SF-regions in the disk are plotted in blue. The vertical dashed lines show the median value of Zgas for each of the components in the same colour. |
Appendix B: Radial Zgas
Computed Zgas distribution based on strong line calibration relations as a function of radius, as described in Sec. 5.
All Tables
All Figures
|
Fig. 1. BPT diagnostic diagram for Circinus and IC 5063 to distinguish between AGN and SF ionised regions. The solid black line and the solid blue line show the discrimination between the two populations according to the boundaries from Kewley et al. (2001) and Kauffmann et al. (2003), respectively. Blue stars and red circles mark AGN- and SF-dominated regions, respectively, while small gray dots demonstrate the entire set of spaxel data. |
| In the text | |
|
Fig. 2. Distribution of Zgas for the AGN parts in disc(red), redshifted (black) and blueshifted (green) outflow. SF-regions in disk is plotted in blue colour. The vertical dashed lines show the median value of Zgas for each of the components in the same colour. The Zgas for CIRCINUS, and IC 5063 are shown here while other galaxies are demonstrated in Appendix A. |
| In the text | |
|
Fig. 3. IC 5063 metallicity gradient profiles for disc (left column), redshifted (middle column), and blueshifted (right column) outflow of MAGNUM galaxies using the Storchi-Bergmann et al. (1998) and Pettini & Pagel (2004) metallicity relations for AGNs (red circles) and SF regions (blue circles), respectively, with the radius (in pc) given on the bottom axis. Overplotted are binned linear fits to the radial metallicity gradient in AGNs (dotted red lines) and SF regions (dotted blue lines). The bigger dots mark the binned median values, and error bars represent the scatter in the data within each bin. |
| In the text | |
|
Fig. A.1. Distribution of Zgas in CENTAURUS A, NGC 1068, NGC 1365, NGC 1386, NGC 2992, NGC 4945, and NGC 5643. The AGN parts are shown in disc (red), redshifted (black), and blueshifted (green) outflow components while the SF-regions in the disk are plotted in blue. The vertical dashed lines show the median value of Zgas for each of the components in the same colour. |
| In the text | |
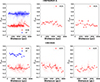 |
Fig. B.1. Same as Fig. 3, but for Centaur A and Circinus metallicity gradient profiles. |
| In the text | |
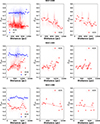 |
Fig. B.2. Same as Fig. 3, but for NGC 1068, NGC 1365, and NGC 1386. |
| In the text | |
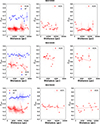 |
Fig. B.3. Same as Fig. 3, but for NGC 2992, NGC 4945, NGC 5643. |
| In the text | |
Current usage metrics show cumulative count of Article Views (full-text article views including HTML views, PDF and ePub downloads, according to the available data) and Abstracts Views on Vision4Press platform.
Data correspond to usage on the plateform after 2015. The current usage metrics is available 48-96 hours after online publication and is updated daily on week days.
Initial download of the metrics may take a while.