Fig. 4
Download original image
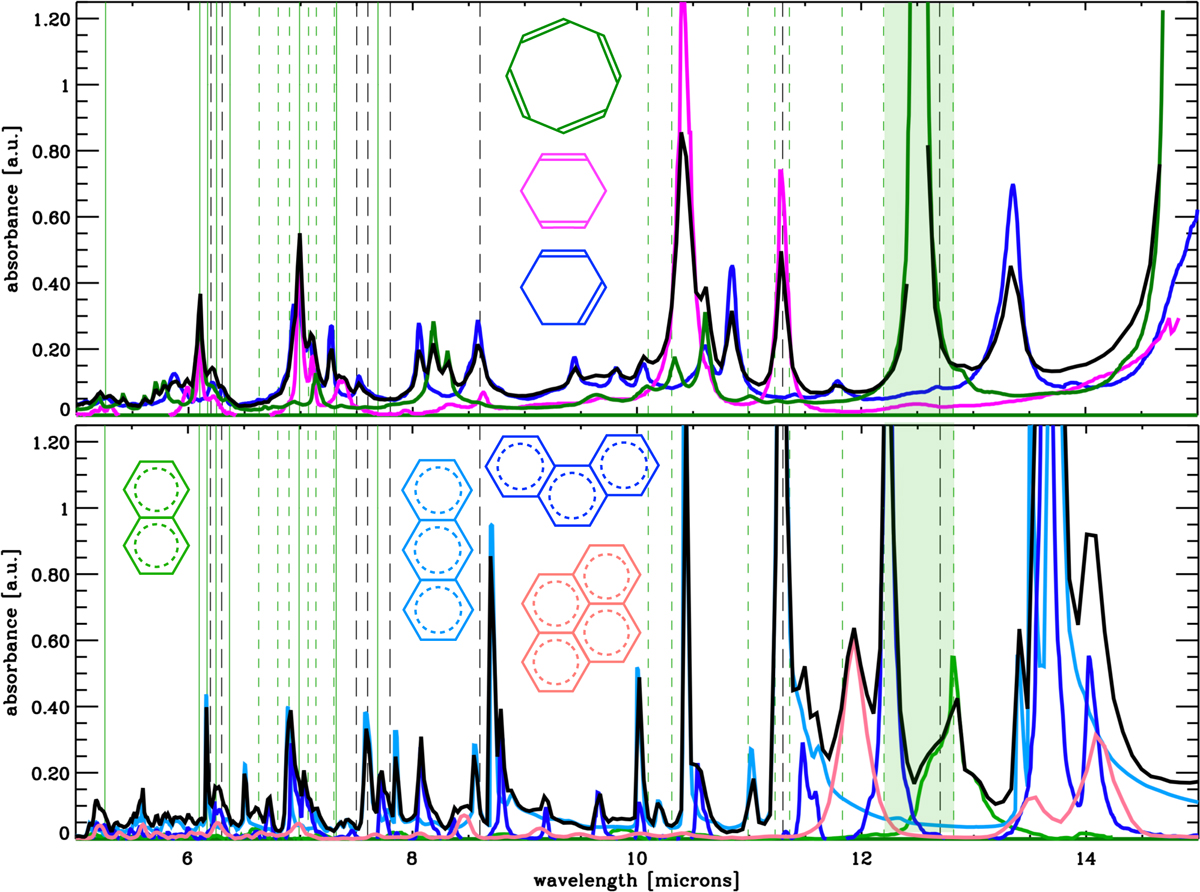
5–15 μm spectrum of the same species, and in the same proportions, as in Fig. 1. The vertical long-dashed black lines indicate the band centres of the interstellar emission bands. The short-dashed (shaded area) and solid green lines show the a-C(:H) modes (range) assigned to CH and CC bonds, respectively (e.g. Dartois et al. 2005; Pino et al. 2008; Robertson 1986).
Current usage metrics show cumulative count of Article Views (full-text article views including HTML views, PDF and ePub downloads, according to the available data) and Abstracts Views on Vision4Press platform.
Data correspond to usage on the plateform after 2015. The current usage metrics is available 48-96 hours after online publication and is updated daily on week days.
Initial download of the metrics may take a while.