| Issue |
A&A
Volume 703, November 2025
|
|
|---|---|---|
| Article Number | A29 | |
| Number of page(s) | 9 | |
| Section | Interstellar and circumstellar matter | |
| DOI | https://doi.org/10.1051/0004-6361/202556756 | |
| Published online | 30 October 2025 | |
The nature and evolution of a-C(:H) nanoparticle substructures and speculations on the origin of the 3–4 μm emission bands
Institut d'Astrophysique Spatiale, UMR8617, CNRS, Université Paris-Saclay,
Bât. 121,
91405
Orsay Cedex,
France
★ Corresponding author: This email address is being protected from spambots. You need JavaScript enabled to view it.
Received:
5
August
2025
Accepted:
14
September
2025
Abstract
Context. The nature and evolution of hydrocarbonaceous grains within interstellar and circumstellar media is still far from resolved, perhaps owing to the complex nature of their seemingly simple binary atomic compositions.
Aims. This work explores the fine details of the composition of amorphous hydrocarbon nanoparticles, a-C(:H), as well as the evolution of their inherent substructures under extreme conditions, focusing on the characteristic CHn bands in the 3–4 μm wavelength region. Methods. Particular attention is paid to the role of dehydrogenation and its effects on the sp3 and sp2 hybridisations that can lead to an extensive conjugated domain functionalisation of the contiguous structural network within a-C(:H) nanoparticles.
Results. Qualitatively, this approach is able to explain the origin and evolution, including the appearance and disappearance, of emission bands observed in the 3–4 μm wavelength regime without a significant aromatic moiety content within the structures. Conclusions. A diatomic a-C(:H) phase is likely at the heart of the dust evolution in the interstellar medium and circumstellar and photodissociation regions observed at short wavelengths. It appears that we have some way to go in fully understanding these complex materials. Much laboratory work is required to elucidate their chemical and structural evolution at nanoparticle sizes under extreme conditions.
Key words: dust, extinction / evolution / ISM: general / ISM: lines and bands / ISM: molecules
© The Authors 2025
 Open Access article, published by EDP Sciences, under the terms of the Creative Commons Attribution License (https://creativecommons.org/licenses/by/4.0), which permits unrestricted use, distribution, and reproduction in any medium, provided the original work is properly cited.
This article is published in open access under the Subscribe to Open model. This email address is being protected from spambots. You need JavaScript enabled to view it. to support open access publication.
1 Introduction
Carbonaceous materials in their hydrogenated forms are a key component of the dust within the interstellar medium (ISM) and circumstellar media. Numerous models have been built to interpret dust observations (e.g. Siebenmorgen & Kruegel 1992; Dwek et al. 1997; Draine & Li 2001; Zubko et al. 2004; Compiègne et al. 2011; Jones et al. 2013; Siebenmorgen et al. 2014; Jones et al. 2017; Draine et al. 2021) using an array of carbon forms to successfully match observational data, including graphite, amorphous carbon, hydrogenated amorphous carbon, polycyclic aromatic hydrocarbons (PAHs), and fullerenes. This material diversity illustrates an inherent degeneracy in the dust modelling process and highlights the fact that the detailed nature and evolution of interstellar (hydro)carbonaceous dust within these media is still far from resolved. The intrinsic difficulty of the problem arises from the rather complex nature of such a seemingly simple, primarily carbon but often binary (C and H), atomic composition material, which encompasses diamond, graphite, fullerenes, graphene, graphene quantum dots, carbon quantum dots, carbon polymeric dots, (hydrogenated) amorphous carbons [a-C(:H)], carbon nanotubes, and PAHs. In addition to composition, particle size effects are extremely important on nanometre scales because they impose significant constraints upon their structural make-up (e.g. Jones 2012c, 2025).
The ideas and speculations presented here are an extension of the inherent nature of interstellar a-C(:H) nanoparticle dust within the THEMIS (The Heterogeneous dust Evolution Model for Interstellar Solids) framework (Jones 2012a,b,c; Jones et al. 2013; Köhler et al. 2014; Ysard et al. 2016; Jones et al. 2016; Jones 2016a,b,c; Jones et al. 2017; Ysard et al. 2024). Unlike other widely used dust models, the THEMIS approach to modelling a-C(:H) interstellar dust (Jones 2012a,b,c; Jones et al. 2013, 2017; Jones & Ysard 2025) encompasses the view that the dust properties respond to, and reflect, the immediate environment, principally the local radiation field but also the gas density and temperature. The observed spectral variations of carbonaceous dust must therefore be seen in terms of a coupled evolution of its chemical composition, structure, and size and shape distribution.
This work focuses on the emission bands observed over the 3–4 μm wavelength range because they generally originate from the smallest particles in the dust size distribution, i.e. the nanoparticles, which are the most vibrationally and thermally excited and therefore dominate the emitted dust spectrum in this spectral region. These are the particles undergoing the most extreme evolution, especially in photo-dissociation regions (PDRs); they are in all probability heading towards an end-of-the-road structural state and will ultimately be completely dismembered through extreme-ultraviolet (EUV; Eh v ≳10.2 eV, λ ≲ 121 nm) photon-driven bond dissociation, restructuring, and fragmentation.
This work relies upon an accurate attribution of the CHn (n = 0 to 3) stretching bands of hydrocarbon materials within the 3–4 μm spectral window. Essential to this are the numerous experimental studies on the nature and evolution of hydrocarbonaceous materials used in the interpretation of astronomical carbon dust observations (e.g. Robertson 1986; Joblin et al. 1994; Ristein et al. 1998; Dartois et al. 2004a,b, 2005; Pino et al. 2008; Mennella 2008; Godard et al. 2012; Carpentier et al. 2012; Gerber et al. 2025).
This paper is structured as follows: Section 2 presents some analogues of a-C(:H) substructures, Sect. 3 details their likely evolution, Sect. 4 speculates on the origins of the 3.3 μm band, Sect. 5 summarises the carbon backbone (CC bond) network evolution and makes some experimental suggestions, and Sect. 6 discusses the astrophysical implications.
2 a-C(:H) nanoparticle substructure analogues
The data used in this analysis are summarised in Table 1, and the corresponding 3–4 μm spectra are presented in Fig. 11. In Table 1 the bands have been grouped and attributed according to the associations inferred from the spectra of a selected group of conjugated olefinic-aliphatic (1,3-cyclohexadiene, C6H8, 1,4-cyclohexadiene, C6H8, and cyclooctatetraene, C8 H8)2 and aromatic molecules (naphthalene, C10 H8, anthracene, C14 H10, phenanthrene, C14 H10, and pyrene, C16 H10). These cyclic molecules were chosen to be representative of the constituent olefinic-aliphatic substructures and the most abundant aromatic moieties within a-C(:H) nanoparticles (e.g. Jones 2012c; Jones & Ysard 2025). It is of note that none of these molecules would be long-lived in the diffuse ISM, PDRs, or H II regions because their lifetimes in these regions are significantly shorter than that of the parent nanoparticles against photo-destruction within those regions (e.g. Allain et al. 1996a,b; Allain & Leach 1997; Jochims et al. 1999; Jones & Ysard 2025). Their characteristic infrared signatures would therefore only be observable if they were to form part of a larger and more stable molecule or nanoparticle.
The CH absorption bands associated with these seven selected molecules can be grouped by their central wavelengths, to within ± 0.02 μm. This gives some leeway and allows for the fact that the exact band centres for particular CHn(n ⩽ 2) olefinic, aromatic, or aliphatic configurations depends upon the local environment within a specific molecule or a-C(:H) substructural unit. This is perhaps evident in the comparison of the associated band positions, as inferred in this work, and as measured in the laboratory (e.g. Boutéraon et al. 2019).
The spectra of these molecular systems exhibit broad groups of bands in terms of their intensity and shape characteristics (see Table 1 and Fig. 1). For the aromatics, these are
| −3.26-3.32 μm | (strong, narrow) and |
| −∼ 3.35 μm | (weak shoulder), |
| and for the aliphatics and olefinics | |
| −3.28-3.32 μm | (strong, broad), |
| −∼ 3.36 μm | (weak shoulder), |
| −3.39-3.41 μm | (strong, broad), |
| −∼ 3.45 μm | (weak, narrow) |
| −∼ 3.47 μm | (strong, broad), and |
| −3.51-3.53 μm | (strong, broad). |
It is notable that the dispersions in the band centres are at most ± 0.02, which gives some confidence that the so-grouped bands in this suite of molecules can indeed be assigned to particular CHn group configurations. It is also notable that the positions of these bands, if not their intensities, bear a remarkable resemblance to the positions of the observed IR emission bands (also shown in Table 1). The attributions of certain of these IR CH stretching bands are widely accepted (e.g. Boutéraon et al. 2019):
| −3.29 μm aromatic CH | (∼ 3.25 μm, benzene) |
| −3.42 μm asymmetric CH2 | (3.42 ± 0.01 μm) |
| −3.47 μm tertiary aliphatic CH | (3.43–3.47 μm) |
| −3.50 μm symmetric CH2 | (3.50 ± 0.01 μm). |
However, as presented in this study, some of these attributions may be somewhat ambiguous and are not necessarily unique.
The aromatic systems considered in this study are small because they best represent the most likely structures to be found as the aromatic domains within a-C(:H) materials at nanometre particle size scales (e.g. Jones 2012a). We thus considered all of the expected two-ring (naphthalene) and three-ring structures (anthracene and phenanthrene), as well as the most compact four-ring structure (pyrene). Benzene, not studied here, shows three narrow bands in the ≃ 3.25 μm region due to aromatic CH bands. A broader band at these same wavelengths is a characteristic of the spectra of co-added fully aromatic molecules (Sandford et al. 2013), which appears to be inconsistent with the interstellar PAH hypothesis. However, the small 2–4 ring aromatics studied here have bands in the range 3.26–3.32 μm region and a blend of their spectra (see Fig. 1) is in better agreement with observations of the 3.3 μm band. Further, the blend of the three conjugated molecules shown in the upper panel of Fig. 1 also gives a band seemingly in good agreement with the observed position of the 3.3 μm band. Thus, despite the very widely held view, it appears that aromatic molecules may not be the only possible interpretation of the observed 3.3 μm IR emission band, which is seemingly composed of two sub-bands (Song et al. 2003) of possible sp2 olefinic and/or aromatic origin (Sadjadi et al. 2017; Boutéraon et al. 2019).
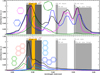 |
Fig. 1 Spectra of a selected set of conjugated cyclic and aromatic molecules. Upper panel: Conjugated, non-planar molecules 1,3-cyclohexadiene (blue), 1,4-cyclohexadiene (violet), and cyclooctatetraene (green; see also Fig. 3). Lower panel: planar, aromatic molecules naphthalene (green), pyrene (rose), anthracene (cobalt), and phenanthrene (blue). The black lines are the normalised spectra of the blended sub-components in the relative fractions |


3 a-C(:H) nanoparticle substructure evolution
In the diffuse ISM all dust species are subject to prolonged irradiation by UV and EUV photons and also to ion irradiation in interstellar shock waves and through cosmic rays. Siliceous materials are rather resistant to irradiation, but carbonaceous materials, particularly those containing a significant hydrogen atomic fraction (i.e. aliphatic-rich a-C:H) are susceptible to energetic photons and ions. This photolysis or photo-processing (or radiolysis in ion irradiation) acts directly through dissociation, or indirectly through heating and thermal processing, leading to changes in the chemical, structural and physical properties of hydrocarbon materials and thence to changes in their optical and spectral properties. An experimental and theoretical understanding of photo-processing and ion irradiation effects on amorphous hydrocarbon materials is key to advancing our understanding of how these materials evolve under ISM conditions (e.g. Pino et al. 2008; Godard & Dartois 2010; Godard et al. 2011, 2012; Carpentier et al. 2012; Jones 2012a,b,c; Alata et al. 2014; Pilleri et al. 2015; Alata et al. 2015).
The primary processes operating during the photolysis of a-C(:H) solids are the removal of H atoms (dehydrogenation) and the associated transformation of saturated, aliphatic, single sp3 C−C bonds into unsaturated, olefinic double C=C and aromatic C ≃ C sp2 bonds. In order grasp the essential and fundamental elements of how exactly carbonaceous materials evolve chemically and structurally, we went back to the basics and considered the chemical building blocks of a-C:H solids. It is clear that (poly-)cyclic species, such as those found in asphaltenes, are an important component in their structures (e.g. Robertson 1986, 1988; Jones 2012a,b,c; Cataldo et al. 2013). Considering isolated six-fold ring systems, starting with cyclohexane-type structures (see Fig. 2), we can understand how these simple systems evolve as a result of dehydrogenation processes. A likely sequence for this radiative processing is shown in Fig. 2, where step-wise dehydrogenation transforms a single six-fold aliphatic cycle into an aromatic benzene-type structure with the removal of a pair of hydrogen atoms at each step. Experimental evidence points to the removal of pairs of atoms as molecular hydrogen under the effects of photolysis, ion irradiation and thermal annealing (Smith 1984; Adel et al. 1989; Marée et al. 1996; Alata et al. 2014).
Given that IR spectra are the well-determined diagnostic chemical fingerprints for the CHn(n = 1–3) vibrational modes in hydrocarbons, we could compare their spectra in the 3–4 μm wavelength region in order to elucidate the characteristic signatures of the CHn bonding structures to be found within a-C(:H) nano-grains in the ISM. To do this, we considered the attribution of the CH stretching modes using a recent graphically illustrated compilation (Boutéraon et al. 2019, Fig. 1) and the spectra of the selected molecules in Fig. 1. Table 2 summarises this sequence and shows how the number and types of constituent functional groups evolve with the dehydrogenation steps. From top to bottom and left to right this table indicates the disappearance of aliphatic CH2 groups and appearance olefinic CH configurations, leading to a progressive replacement of the aliphatic CH2 (3.41–3.43, 3.50–3.51 μm) and CH(3.43–3.47 μm) modes with olefinic modes (3.31–3.34 μm).
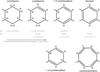 |
Fig. 2 Dehydrogenation scenario for the cyclic structures within a-C(:H), starting with a cyclohexane-like ring, evolving through cyclohexene-like and cyclohexadiene-like rings, and ending with an aromatic benzene-like ring. The H atoms inside (outside) the rings are tertiary 3° sp3(sp2) CH groups, and the paired H atoms are sp3 CH2 groups. |
4 The origin of the 3.3μm emission band
In considering the composition, structure and substructures of a-C(:H) materials it is something of an open question as to the exact form and nature of their constituent polycyclic systems. It is generally considered that, in their bulk form, these semiconducting materials consist of aliphatic, olefinic, and aromatic domains or moieties (e.g. Robertson 1986; Robertson & O'Reilly 1987; Robertson 1988; Ferrari & Robertson 2004). However, it is not clear that this is also necessarily the case for finite-sized particles, particularly when those particles have dimensions of the order of a nanometre or less (Jones 2012a,b,c) as per the a-C(:H) nanoparticles proposed within THEMIS. The details of the structure of particles with, at most only hundreds of atoms, is particularly important because the interstellar PAH hypothesis posits that the observed 3–13 μm emission bands are due to PAH molecules with a range of sizes. However, there are several issues with this hypothesis, which appear to have been somewhat put aside over the years. Firstly, perfect, planar PAHs cannot explain the presence of the aliphatic CHn emission bands in the 3.4–3.5 μm wavelength region, without invoking a significant sp3 carbon component, which must lead to a deformation of the molecular shape and possibly to a loss of planarity. Secondly, it assigns the 3.3 μm emission band to aromatic CH bonds, something that is not particularly well supported by laboratory studies, which show that the measured PAH aromatic CH bands peak over the ∼ 3.2–3.3 μm wavelength region for a wide range of molecules (e.g. Sandford et al. 2013, Fig. 3).
Chemistry tells us that there are necessary criteria that determine whether a molecule or a domain that could be aromatic actually is aromatic. Following Hückel's rule, in order for a molecule to be aromatic it must be: cyclic, planar, fully conjugated (every atom have p orbitals), and have (4n+2) π electrons (integer n ≥ 0). If a molecular structure does not meet all of these criteria it is unlikely to be aromatic.
The fact that the interstellar PAH hypothesis needs to invoke sp3 components to explain the observed 3.4 μm aliphatic CHn emission bands is troubling because the introduction of a significant sp3 hybridised carbon component into the ring structure of a PAH will lead to a distortion of its structure and a partial or complete loss of planarity. By the above rules, this would lead to some loss of aromaticity and will affect the characteristic IR band signatures.
Cyclooctatetraene (see Fig. 3) is an example of a fully conjugated system3 that contains only cis H>C=C<H groups and no aliphatic methylene (–CH2–) groups, exhibits a 3.31 μm band, and is not aromatic because it is non-planar4. Consequently the CH stretching bands typical of PAHs and peaking in the ∼ 3.27–3.32 μm wavelength region (e.g. Boutéraon et al. 2019) are complemented by that of conjugated cyclic molecules that also have CH stretching peaks in this same range (see Fig. 1), for example: cyclooctatetraene (3.31 μm), 1,4-cyclohexadiene (3.30 μm), and 1,3-cyclohexadiene (3.27 μm). The shapes of these molecules are illustrated in Fig. 3. Note that none of the selected molecules contain a terminating =CH2 group but only cis H>C=C<H and –CH2– (methylene) groups. Given that they contain only two types of CH functional group (–CH= and −CH2-) they yield more restricted spectral features in the 3–4 μm region (see Fig. 1). Thus, if we only consider the 3–4 μm emission bands, it would appear that cyclic, non-aromatic, conjugated sp2 systems could also be a contributor to the strongest of the observed bands in this wavelength region.
In a similar vein, the sterically strained and distorted multibenzenoid aromatics in the THEMIS a-C(:H) nanoparticles (Jones 2012c; Micelotta et al. 2012) cannot be fully aromatic because they are not perfectly planar. Their IR spectra will therefore more closely resemble highly or fully conjugated polycyclic and linear systems, such as the olefinic-aliphatic or alkene-alkane molecules discussed here.
Analysis of the CH bonding characteristics of isolated hexa-cyclic molecules and the octa-cyclic molecule cyclooctatetraene.
Another concern with the interstellar PAH hypothesis is that the observed 3.3 and 11.3 μm emission bands are often used as a measure of the charge state of the carriers within the interstellar PAH hypothesis, with the 3.3 μm coming from neutral PAHs and the 11.3/3.3 μm band ratio increasing with the ionisation state (e.g. Tielens 2008, Sect. 4.2.1). This same effect can also be attributed to an increase in PAH size, which is also coherent with a decrease in the 6.2/7.7 μm band ratio (e.g. Rigopoulou et al. 2021). The use of these trends in interpreting the observed emission band ratios relies upon the implicit assumption that the bands essentially come from a single, or at least restricted, size range of the originating molecules. However, we know from extensive modelling of the interstellar nanoparticle emission that we are in all probability dealing with a broad size distribution of particles exhibiting a range of size-dependent temperatures (e.g. Siebenmorgen & Kruegel 1992; Dwek et al. 1997; Draine & Li 2001; Zubko et al. 2004; Compiègne et al. 2011; Jones et al. 2013; Siebenmorgen et al. 2014; Jones et al. 2017; Draine et al. 2021). Thus, interpretation of the interstellar carbonaceous dust emission bands has to take into account the size distribution and, hence, the relative band intensities as a function of the temperature distribution across the given size distribution. In other words, the observed 3.3 and 11.3 μm emission bands likely do not originate from exactly the same particles, with the longer wavelength bands coming from somewhat larger species. Thus, depending upon the underlying model assumptions, this could skew the arrived at interpretation. As a close look at Fig. 12 of Jones et al. (2013) and Fig. 1 of Galliano et al. (2021) show, an increase in the 11.3/3.3 μm band ratio can be explained with THEMIS by an increase in the particle size, for a fixed interstellar radiation field (ISRF), with the ratio increasing substantially (by about a factor of 100) as the minimum particle size increases from 0.4 nm to 1 nm. The changing ratio is always dominated by a decrease in the 3.3 μm band intensity. Further, Fig. 11 of Jones et al. (2013) shows that a changing 11.3/3.3 μm band ratio could also be attributed to a change in the a-C(:H) nanoparticle composition and structure, particularly for wide band gap a-C(:H) materials (Eg ≥ 0.5 eV). However, for the materials that are of most interest to us in the diffuse ISM and in PDRs only narrow gap materials (Eg<0.2 eV) are of relevance and for them the 11.3/3.3 μm band ratio varies little for a given size of particle.
It is evident that a complete study should include a consideration of the longer wavelength emission bands (λ>4 μm) and their relationship with the bands in the λ = 3–4 μm region. However, we are most interested in the structure and composition of the smallest interstellar dust particles (a<1 nm); they are at the origin of the 3–4 μm emission bands, which are undergoing extreme end-of-the-road evolution en route to their eventual destruction. We thus concentrated on the bands that most characterise their properties. For this study we therefore did not consider the longer wavelength emission bands (though see a brief discussion in the following section) and instead focused on the smallest and hottest nanoparticles, which, as in the THEMIS model, do not necessarily have the same structural configurations as their larger counterparts (Jones 2012c). The larger particle chemical substructures will be more diverse, relaxed and resistant against UV photo-processing. They can therefore retain a wider variety of chemical compositions encompassing less strained cyclic systems including planar aromatic moieties. The bottom line is that it is the smallest interstellar nanoparticles that will, most likely, consist of (sub)structures that exhibit rather extreme forms, particularly in such extreme environments as the diffuse ISM and the Orion Bar and Horsehead PDRs. In these regions they will tend towards the most stable structural configurations possible, likely exhibiting a rather limited range of substructures. These will be highly strained structures that deform what would normally be planar aromatic moieties into distorted, maximally conjugated, mixed linear and cyclic systems.
The spectra of the considered hexa-cyclic molecular species 1,4- and 1,3-cyclohexadiene (C6H8) are shown in Fig. 1, along with that of the poly-octa-cyclic, fully conjugated molecule cyclooctatetraene (C8 H8): note that none of the molecules in the upper panel are planar. For comparison the lower panel shows the spectra of a selected set of small (number of aromatic rings, NR ⩽ 4), planar, aromatic molecules (naphthalene, anthracene, phenanthrene, and pyrene), all of which are planar. For the conjugated molecules there appears to be a systematic shift in the band position from 3.32 to 3.29 to 3.26 μm with increasing energy, and as the rigidity of the structures likely increases (from cyclooctatetraene to 1,4- and then 1,3-cyclohexadiene), which would appear to be coherent with the expected behaviours of IR band positions. Note how the spectrum of the nonplanar, non-aromatic, fully conjugated molecule cyclooctatetraene, which contains only –CH= functional groups in cis H>C=C< H and H ≥ C−C ⩽H structures, qualitatively resembles that of the aromatic molecules anthracene and phenanthrene, in the sense that the spectrum shows only one predominant band with long wavelength shoulder features. For the blended spectra (black lines), the positions of the 3.3 μm bands occur at 3.29 μm for the conjugated olefinics and at 3.28 μm for the aromatics, which is a small but significant difference. Note that for the conjugated molecules, the position of the 1,4-cyclohexadiene band occurs at 3.29 μm, that is, it is almost exactly at the position of the observed interstellar emission band. Also, the band widths of the blended spectra appear to be different for these two groups of molecules, being broader for the conjugated olefinic molecule blend where the constituent molecules exhibit intrinsically wider features. Bear in mind that the spectra presented here are for absorbance, whereas the observed interstellar bands are predominantly seen in emission.
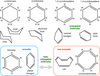 |
Fig. 3 Structure of cyclic molecules containing C=C bonds. Benzene is the only planar aromatic structure: all other molecules have only sp3 >CH2 and/or sp2 cis olefinic H>C=C<H groups. |
5 Evolution of the CC network bonds and bands
In their laboratory experiments and IR spectral analysis of more than 50 soot samples, Pino et al. (2008) find a clear link between the ratio of the 3.3 and 3.4 μm CH stretching bands and the position of the CC stretching mode at 6.2 μm. The latter mode is characteristic of the nature of the carbon backbone structures within hydrogenated amorphous carbon networks. They find that, as the ratio 3.3 /(3.3+3.4) increases, the CC mode shifts from 6.3 μm to 6.2 μm likely tracing the transformation of carbonaceous dust from aliphatic-rich (6.3 μm) to aromatic-rich (6.2 μm). In the ISM such an effect would be consistent with photo-processing within a given interstellar or circumstellar environment. Pino et al. (2008) also find that the most commonly observed IR emission bands, the so-called Class A (λCC ∼ 6.2 μm), are most likely composed of more mature, end-of-the-road species, while the less common class C spectra (λCC ∼ 6.3 μm) appear to be associated with less processed materials consisting of small aromatic units linked by aliphatic bridges, all embedded within a contiguous network structure.
5.1 The 5–15 μm spectrum
Ideally, we would perform the same kind of exercise as that shown in Fig. 1, and as discussed above, in order to explore the nature and origin of the 6.2–6.3 μm band at a simplified molecular level. However, because this band is rather a diagnostic of contiguous a-C(:H) network structures, a molecular level comparison would be insufficient. The exact position and form of the 6.2–6.3 μm band almost certainly reflects the intimate details of the extended, conjugated substructures (i.e. −C=C−C=C−C=C−) to be found within the mixed aliphaticolefinic and aromatic domains that are key to the contiguous random covalent networks that constitute the extensive family of amorphous (hydro)carbon solids.
Figure 4 shows the long wavelength spectrum (5–15 μm) equivalent to Fig. 1. Unfortunately, it is not possible to assign most of these of bands but in order to make comparisons the interstellar emission band centres and the a-C(:H) CC and CH band positions are marked. Not wishing to over-interpret these data it is nevertheless possible to make a few qualitative inferences. It is noteworthy that the aromatics show a somewhat more complex spectrum than the conjugated species. With respect to the interstellar emission bands, features in the 6.2, 8.6, and 11.3 μm regions are evident in the combined spectra of the aromatics and conjugated species, and in the 7.7 μm region are seen in the aromatics, though the band shapes and intensities are very different from those observed in the ISM. With respect to the a-C(:H) assignments, the 6.2 μm region is well populated by CC modes and there is a general correspondence between the CH modes and those seen in the combined spectra. However, many bands in the 6.5–7.5 μm region do not seem to correspond to any interstellar bands and there is a strong 7 μm CC mode present in both sets. As discussed in Sect. 3, the selected set of molecules is over-populated with hydrogen atoms, with respect to a-C(:H) solids, and the CH bands are therefore over-represented in this assignment comparison. Further, the carbon backbone or skeletal modes will be significantly different from the CC modes of the selected molecules because of steric and strain effects due to the incorporation of these kinds of moieties within a 3D a-C(:H) network. This may help explain the differences noted here between the molecular modes of these molecules and the modes assigned to a-C(:H) random covalent networks.
5.2 Restructuring
The structures A to F illustrated in Fig. 5 are 2D representations (thin lines) of idealised 3D closed loop structures (thicker lines), which are maximally conjugated systems exhibiting only cis H>C=C<H and aromatic CH functional groups5. Thus, all the olefinic CH bonds in the upper three structures (A, B, and C) should essentially show only a single 3.3 μm band. The C structure is shown in a partially aromatic configuration D that will also give a 3.3 μm aromatic CH stretching band, albeit one likely arising from deformed aromatics that are non-planar due to structural strain. The transformation of a highly hydrogenated, aliphatic-aromatic form of the C36 structure (F, C36 H32) into an olefinic-aromatic form (D, C36 H24) involves an eight-atom dehydrogenation but its further transformation into an olefinic form (C) involves only an isomerisation of the carbon backbone, as is also required to transform the C36 H16 structure between its fully conjugated (B) and fully aromatic (E) forms. The associated structural transformations towards unsaturated, fully conjugated systems requires C=C bond migration during the rearrangement, something that can occur during UV photocatalysis (e.g. Ma et al. 2021). It is therefore reasonable to hypothesise that under the effects of interstellar UV photolysis, in the diffuse ISM and in highly excited PDRs and H II regions, these structures will most likely transform into their more deformable, highly conjugated forms rather than retain a high degree of aromaticity in sterically strained conformations.
The types of closed loop structures studied here are minimally hydrogenated and will likely be stable against further UV photo-processing dehydrogenation. In reality relatively stable end-of-the-road structures such as these would probably contain a larger number of atoms than those illustrated here. Additionally, the removal of further hydrogen atoms, and also carbon backbone atoms, would lead to radical structures that have weaker or no CH emission bands and that are therefore not observable in emission at 3–4 μm wavelengths. However, they may still exist within a given medium and exhibit a 6.2 μm band along with any other CC modes at longer wavelengths.
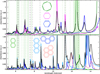 |
Fig. 4 5–15 μm spectrum of the same species, and in the same proportions, as in Fig. 1. The vertical long-dashed black lines indicate the band centres of the interstellar emission bands. The short-dashed (shaded area) and solid green lines show the a-C(:H) modes (range) assigned to CH and CC bonds, respectively (e.g. Dartois et al. 2005; Pino et al. 2008; Robertson 1986). |
5.3 Experimental suggestions
This work underlines the need for experimental studies targeted at advancing our understanding of how sub-nanometre hydrocarbon nanoparticles restructure in response to EUV irradiation (EEUV ≳10.2 eV), which can lead to unexpected structural transformations (e.g. Jones 2016b; Ma et al. 2021). The inferences made here imply that in highly excited regions the nanoparticles are probably not PAHs but could be fully conjugated, polycyclic, olefinic sp2 systems. Their structural forms might resemble the ring-shaped segments of carbon nanotubes known as nanobelts (e.g. Imoto et al. 2023) or take on shell-like forms.
An experimental protocol designed to investigate the conclusions of this work would have to work with isolated nanoparticles containing fewer than a few hundred atoms while they are subject to EUV irradiation. Ideally this could be performed in the gas phase using a time of flight apparatus but might, in the first instance, be possible with matrix isolation techniques. As a starting point it should be possible to spectroscopically analyse hydrogenated carbon nanotube fragments (nanobelts) or carbon nanodots (e.g. Jones 2025) at low temperatures before and after EUV irradiation. This could then be coupled with the more difficult task of determining their structural compositions whilst in their ground and excited states, which may be significantly different.
6 Astrophysical implications?
The 3–4 μm spectral region is an important, but not exclusive, diagnostic tool for determining the nature of hydrocarbon dust in the ISM (e.g. Pendleton & Allamandola 2002). The dust emission spectra in this wavelength domain are dominated by the so-called aromatic CH band at 3.29 μm, which is almost always accompanied by a broad 3.4 μm aliphatic band. However, in absorption the 3.29 μm band is intrinsically weak compared to the olefinic and aliphatic CHn modes in this same wavelength region (e.g. Jones 2012c; Pendleton et al. 2025).
In this work the term 'diffuse ISM' is used to mean regions where the bands in the 3–4 μm window are seen in emission. This is in contrast to the recent comprehensive study by Pendleton et al. (2025), where the same term is applied to regions where these bands are seen in absorption. These authors suggest that the 3–4 μm absorption bands arise from carbonaceous grains with aliphatic-rich mantles on aromatic-rich cores, a grain structure that is consistent with somewhat denser regions of the ISM where cloud- and core-shine are observed (Jones et al. 2016; Ysard et al. 2016).
Given that there seems to be a natural block on the evolution of a-C(:H) solids to materials with band gaps smaller than ≍ 0.2 eV (H atom fraction XH ≃ 0.05) during ion or UV irradiation (e.g. Adel et al. 1989; Marée et al. 1996; Gadallah et al. 2011; Godard et al. 2011), there ought then to be a natural block on their spectral evolution. This could perhaps provide an explanation for the origin and practically ubiquitous observation of the Class A emission band spectra briefly discussed in the preceding section. For these limiting compositions (i.e. Eg ≃ 0.1–0.25 eV), the modelling by Jones (2012c) predicts spectra for small particles (a ≲ 1 nm) that exhibit an aromatic CH band with satellite aliphatic CHn bands but little evidence of olefinic CHn bands. Therefore, the aromatic CH band should always be associated with aliphatic (but not olefinic) CHn side bands and/or a plateau in the ≍ 3.35–3.55 μm region. The lack of olefinic CH bands is because, in the eRCN model (Jones 2012a,b,c), the sp2 component in low- XH sub-nanometre particles is predominantly in small aromatic domains that are linked by aliphatic, rather than olefinic, bridging species. Thus, this modelling predicts that no IR emission band spectrum arising from hydrocarbon dust and exhibiting only a 3.29 μm aromatic CH band in the 3–4 μm region will be observable in the ISM. Some evidence that seems to support this prediction, and therefore favour an a-C(:H) origin for the IR emission bands, comes from AKARI observations of the IR emission features in M 82, which show no pure aromatic CH band, only aromatic and aliphatic CH bands that always appear together, even in the very energetic super-wind region of M82 (Yamagishi et al. 2012). In contrast, the PAH and (surfacehydrogenated) graphitic interstellar dust models implicitly allow for the possibility of an isolated 3.29 μm aromatic CH emission band in the 3–4 μm region. Such a 3.29 μm emission band has now been observed by the James Webb Space Telescope (JWST) in the H II region of the Horsehead Nebula (Misselt et al. 2025). As shown in this study, the observation of an isolated 3.29 μm band in extreme excitation regions might be more consistent with end-of-the-road fully conjugated olefinic strained nano-structures containing ≃ 30–50 carbon atoms that are highly dehydrogenated, rather than fully aromatic systems.
Thus, while large PAHs, possibly with more than 50 carbon atoms, would be stable in the diffuse ISM, their aromatic CH stretching bands generally occur in the 3.25 μm region and are therefore probably not a good explanation for the observed 3.3 μm emission band. In contrast, small PAHs with one to four rings and fewer than 20 carbon atoms give a much better match to the 3.3 μm emission band but, as isolated molecular species, are easily photo-dissociated in the diffuse ISM. Nevertheless, if they were to exist as substructures within larger particles, such as in a-C(:H) nanoparticles, then they would indeed be long-lived enough to contribute to the observed emission bands. However, in this case they are likely to have strained non-planar structures and therefore reduced aromaticity. It is noteworthy that fully conjugated olefinic systems can fit the 3.3 μm band equally as well as these one- to four-ring PAHs.
It is worth noting that the wavelength positions and shapes of the conjugated olefinic –CH2 - and –CH= bands, longwards of the 3.3 μm band, at 3.40 ± 0.01,3.46 ± 0.02, and 3.52 ± 0.01 μm seen in Fig. 1 appear to provide a good match to the observed Orion 3–4 μm emission spectra (e.g. Sloan et al. 1997) and to provide a better fit to the more recent JWST data made using the diffuse ISM THEMIS model (Elyajouri et al. 2024). It is also possible that the wing at 3.56 ± 0.02 μm, seen in both the laboratory data (see Fig. 1) and the interstellar emission spectra and as yet unidentified, could be due to contamination from an aldehyde CH functional group (e.g. ).
).
The results of Song et al. (2003) are consistent with a twocomponent 3.3 μm band composed of a prominent 3.30 μm band with a sub-feature at 3.28 μm. Both features exhibit a slight shift to shorter wavelengths with distance from the central star, HD 44179, coherent with a decreasing temperature of the carriers. The 3.28 μm feature and a 3.4 μm band are not present in the on-star position but are seen in the offset positions. This points to an evolutionary link between the subordinate 3.28 and 3.4 μm features and the distance from the star. Assuming emission from nanoparticles with the substructure band assignments λμm [origin]: 3.28 [small aromatics], 3.30 [conjugated olefinics], and 3.4[aliphatic CH2], the most stable on-star species is the 3.30 μm band carrier, perhaps indicating that conjugated olefinic structures are more stable than aromatic species in highly excited regions. This result seems to underline the intimate association between the aromatic and aliphatic components of carbon nanoparticles (e.g. Jones & Ysard 2025; Jones 2012c) and points to the stability of conjugated olefinics, and therefore to lessen the significance of interstellar PAHs. We may therefore need to change our current vantage point in order to be able to see interstellar carbon nanodots for what they really are.
In conclusion, we infer that small, pure, perfect, planar PAHs with fewer than ≃ 30 C atoms may not be the dominating nanoparticle dust component that they are often considered to be. It may be that the observable characteristics generally attributed to them (principally the IR emission bands) can be better explained by a distribution of sub-nanometre a-C(:H) particles that, in their final days in extreme environments, are actually highly conjugated, polycyclic, olefinic sp2 systems resembling open loop, bowl, broad ring, or shell structures. Such structures could potentially be regarded as the hydrogenated segments of carbon nanotubes known as nanobelts (e.g. Imoto et al. 2023).
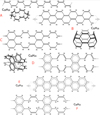 |
Fig. 5 2D examples (thin lines) of fully conjugated 3D systems (thick lines, with the dotted bonds and arrowed or shadowed bonds connected), which exhibit only cis −HC=CH− aromatic CH and >C= functional groups; the latter are sp2 C atoms bonded to three other C atoms. |
Acknowledgements
The author would like to thank the referee for an objective review and encouraging remarks.
References
- Adel, M. E., Amir, O., Kalish, R., & Feldman, L. C., 1989, J. Appl. Phys., 66, 3248 [Google Scholar]
- Alata, I., Cruz-Diaz, G. A., Muñoz Caro, G. M., & Dartois, E., 2014, A&A, 569, A119 [NASA ADS] [CrossRef] [EDP Sciences] [Google Scholar]
- Alata, I., Jallat, A., Gavilan, L., et al. 2015, A&A, 584, A123 [NASA ADS] [CrossRef] [EDP Sciences] [Google Scholar]
- Allain, T., & Leach, S., 1997, A&A, 323, 968 [Google Scholar]
- Allain, T., Leach, S., & Sedlmayr, E. 1996a, A&A, 305, 602 [NASA ADS] [Google Scholar]
- Allain, T., Leach, S., & Sedlmayr, E. 1996b, A&A, 305, 616 [NASA ADS] [Google Scholar]
- Boutéraon, T., Habart, E., Ysard, N., et al. 2019, A&A, 623, A135 [NASA ADS] [CrossRef] [EDP Sciences] [Google Scholar]
- Carpentier, Y., Féraud, G., Dartois, E., et al. 2012, A&A, 548, A40 [NASA ADS] [CrossRef] [EDP Sciences] [Google Scholar]
- Cataldo, F., García-Hernández, D. A., & Manchado, A., 2013, MNRAS, 429, 3025 [Google Scholar]
- Compiègne, M., Verstraete, L., Jones, A., et al. 2011, A&A, 525, A103 [Google Scholar]
- Dartois, E., Marco, O., Muñoz-Caro, G. M., et al. 2004a, A&A, 423, 549 [NASA ADS] [CrossRef] [EDP Sciences] [Google Scholar]
- Dartois, E., Muñoz Caro, G. M., Deboffle, D., & d'Hendecourt, L. 2004b, A&A, 423, L33 [NASA ADS] [CrossRef] [EDP Sciences] [Google Scholar]
- Dartois, E., Muñoz Caro, G. M., Deboffle, D., Montagnac, G., & D'Hendecourt, L., 2005, A&A, 432, 895 [NASA ADS] [CrossRef] [EDP Sciences] [Google Scholar]
- Draine, B. T., & Li, A., 2001, ApJ, 551, 807 [NASA ADS] [CrossRef] [Google Scholar]
- Draine, B. T., Li, A., Hensley, B. S., et al. 2021, ApJ, 917, 3 [CrossRef] [Google Scholar]
- Dwek, E., Arendt, R. G., Fixsen, D. J., et al. 1997, ApJ, 475, 565 [NASA ADS] [CrossRef] [Google Scholar]
- Elyajouri, M., Ysard, N., Abergel, A., et al. 2024, A&A, 685, A76 [NASA ADS] [CrossRef] [EDP Sciences] [Google Scholar]
- Ferrari, A. C., & Robertson, J., 2004, Phil. Trans. R. Soc. Lond. A, 362, 2477 [Google Scholar]
- Gadallah, K. A. K., Mutschke, H., & Jäger, C., 2011, A&A, 528, A56 [Google Scholar]
- Galliano, F., Nersesian, A., Bianchi, S., et al. 2021, A&A, 649, A18 [EDP Sciences] [Google Scholar]
- Gerber, I. C., Mihaila, I., Pohoata, V., et al. 2025, MNRAS, 538, 266 [Google Scholar]
- Godard, M., & Dartois, E., 2010, A&A, 519, A39 [NASA ADS] [CrossRef] [EDP Sciences] [Google Scholar]
- Godard, M., Féraud, G., Chabot, M., et al. 2011, A&A, 529, A146 [NASA ADS] [CrossRef] [EDP Sciences] [Google Scholar]
- Godard, M., Geballe, T. R., Dartois, E., & Muñoz Caro, G. M., 2012, A&A, 537, A27 [NASA ADS] [CrossRef] [EDP Sciences] [Google Scholar]
- Imoto, D., Yagi, A., & Itami, K., 2023, Precis. Chem., 1, 516 [Google Scholar]
- Joblin, C., D'Hendecourt, L., Leger, A., & Defourneau, D., 1994, A&A, 281, 923 [Google Scholar]
- Jochims, H. W., Baumgärtel, H., & Leach, S., 1999, ApJ, 512, 500 [NASA ADS] [CrossRef] [Google Scholar]
- Jones, A. P. 2012a, A&A, 540, A1 [NASA ADS] [CrossRef] [EDP Sciences] [Google Scholar]
- Jones, A. P. 2012b, A&A, 540, A2 [NASA ADS] [CrossRef] [EDP Sciences] [Google Scholar]
- Jones, A. P. 2012c, A&A, 542, A98 [NASA ADS] [CrossRef] [EDP Sciences] [Google Scholar]
- Jones, A. P. 2016a, Roy. Soc. Open Sci., 3, 160221 [NASA ADS] [CrossRef] [Google Scholar]
- Jones, A. P. 2016b, Roy. Soc. Open Sci., 3, 160223 [NASA ADS] [CrossRef] [Google Scholar]
- Jones, A. P. 2016c, Roy. Soc. Open Sci., 3, 160224 [NASA ADS] [CrossRef] [Google Scholar]
- Jones, A. P., 2025, A&A, 699, A16 [NASA ADS] [CrossRef] [EDP Sciences] [Google Scholar]
- Jones, A. P., & Ysard, N., 2025, A&A, submitted [Google Scholar]
- Jones, A. P., Fanciullo, L., Köhler, M., et al. 2013, A&A, 558, A62 [NASA ADS] [CrossRef] [EDP Sciences] [Google Scholar]
- Jones, A. P., Köhler, M., Ysard, N., et al. 2016, A&A, 588, A43 [NASA ADS] [CrossRef] [EDP Sciences] [Google Scholar]
- Jones, A. P., Köhler, M., Ysard, N., Bocchio, M., & Verstraete, L., 2017, A&A, 602, A46 [NASA ADS] [CrossRef] [EDP Sciences] [Google Scholar]
- Köhler, M., Jones, A., & Ysard, N., 2014, A&A, 565, L9 [NASA ADS] [CrossRef] [EDP Sciences] [Google Scholar]
- Ma, W., Liu, B., Wang, D., et al. 2021, in Alkenes - Recent Advances, New Perspectives and Applications, eds. R. Davarnejad (IntechOpen) [Google Scholar]
- Marée, C. H. M., Vredenberg, A. M., & Habraken, F. H. P. M., 1996, Mater. Chem. Phys., 46, 198 [Google Scholar]
- Mennella, V., 2008, ApJ, 682, L101 [NASA ADS] [CrossRef] [Google Scholar]
- Micelotta, E. R., Jones, A. P., Cami, J., et al. 2012, ApJ, 761, 35 [NASA ADS] [CrossRef] [Google Scholar]
- Misselt, K., Witt, A. N., Gordon, K. D., et al. 2025, A&A, 700, A158 [NASA ADS] [CrossRef] [EDP Sciences] [Google Scholar]
- Pendleton, Y. J., & Allamandola, L. J., 2002, ApJS, 138, 75 [NASA ADS] [CrossRef] [Google Scholar]
- Pendleton, Y. J., Geballe, T. R., Chu, L. E. U., et al. 2025, ApJ, 992, 8 [Google Scholar]
- Pilleri, P., Joblin, C., Boulanger, F., & Onaka, T., 2015, A&A, 577, A16 [NASA ADS] [CrossRef] [EDP Sciences] [Google Scholar]
- Pino, T., Dartois, E., Cao, A., et al. 2008, A&A, 490, 665 [CrossRef] [EDP Sciences] [Google Scholar]
- Rigopoulou, D., Barale, M., Clary, D. C., et al. 2021, MNRAS, 504, 5287 [NASA ADS] [CrossRef] [Google Scholar]
- Ristein, J., Stief, R. T., Ley, L., & Beyer, W., 1998, J. Appl. Phys., 84, 3836 [NASA ADS] [CrossRef] [Google Scholar]
- Robertson, J., 1986, Adv. Phys., 35, 317 [NASA ADS] [CrossRef] [Google Scholar]
- Robertson, J., 1988, Philos. Mag. Lett., 57, 143 [Google Scholar]
- Robertson, J., & O'Reilly, E. P., 1987, Phys. Rev. B, 35, 2946 [NASA ADS] [CrossRef] [Google Scholar]
- Sadjadi, S., Zhang, Y., & Kwok, S., 2017, ApJ, 845, 123 [NASA ADS] [CrossRef] [Google Scholar]
- Sandford, S. A., Bernstein, M. P., & Materese, C. K., 2013, ApJS, 205, 8 [NASA ADS] [CrossRef] [Google Scholar]
- Siebenmorgen, R., & Kruegel, E., 1992, A&A, 259, 614 [NASA ADS] [Google Scholar]
- Siebenmorgen, R., Voshchinnikov, N. V., & Bagnulo, S., 2014, A&A, 561, A82 [NASA ADS] [CrossRef] [EDP Sciences] [Google Scholar]
- Sloan, G. C., Bregman, J. D., Geballe, T. R., Allamandola, L. J., & Woodward, C. E., 1997, ApJ, 474, 735 [NASA ADS] [CrossRef] [Google Scholar]
- Smith, F. W., 1984, J. Appl. Phys., 55, 764 [NASA ADS] [CrossRef] [Google Scholar]
- Song, I.-O., Kerr, T. H., McCombie, J., & Sarre, P. J., 2003, MNRAS, 346, L1 [Google Scholar]
- Tielens, A. G. G. M., 2008, ARA&A, 46, 289 [NASA ADS] [CrossRef] [Google Scholar]
- Yamagishi, M., Kaneda, H., Ishihara, D., et al. 2012, A&A, 541, A10 [NASA ADS] [CrossRef] [EDP Sciences] [Google Scholar]
- Ysard, N., Köhler, M., Jones, A., et al. 2016, A&A, 588, A44 [NASA ADS] [CrossRef] [EDP Sciences] [Google Scholar]
- Ysard, N., Jones, A. P., Guillet, V., et al. 2024, A&A, 684, A34 [NASA ADS] [CrossRef] [EDP Sciences] [Google Scholar]
- Zubko, V., Dwek, E., & Arendt, R. G., 2004, ApJS, 152, 211 [NASA ADS] [CrossRef] [Google Scholar]
All molecular infrared data are taken from the NIST database https://webbook.nist.gov/chemistry/name-ser/
The selected cyclic olefinic-aliphatic species exhibit only =CH– and –CH2– functional groups and no methyl groups (-CH3) in order to simplify the analysis. Methyl groups are in any case probably not a significant component of interstellar hydrocarbon dust.
A fully conjugated molecule is made up of alternating single and double sp2 carbon-carbon bonds, e.g. –;HC=CH–HC=CH–HC=CH–.
Cyclooctatetraene exists in a tub conformation and is therefore significantly non-planar as shown in Fig. 3.
In their 3D forms all –HC=CH– groups are cis, even those that appear as trans in their 2D representations (e.g. structure D in Fig. 5).
All Tables
Analysis of the CH bonding characteristics of isolated hexa-cyclic molecules and the octa-cyclic molecule cyclooctatetraene.
All Figures
|
Fig. 1 Spectra of a selected set of conjugated cyclic and aromatic molecules. Upper panel: Conjugated, non-planar molecules 1,3-cyclohexadiene (blue), 1,4-cyclohexadiene (violet), and cyclooctatetraene (green; see also Fig. 3). Lower panel: planar, aromatic molecules naphthalene (green), pyrene (rose), anthracene (cobalt), and phenanthrene (blue). The black lines are the normalised spectra of the blended sub-components in the relative fractions |
| In the text | |
|
Fig. 2 Dehydrogenation scenario for the cyclic structures within a-C(:H), starting with a cyclohexane-like ring, evolving through cyclohexene-like and cyclohexadiene-like rings, and ending with an aromatic benzene-like ring. The H atoms inside (outside) the rings are tertiary 3° sp3(sp2) CH groups, and the paired H atoms are sp3 CH2 groups. |
| In the text | |
|
Fig. 3 Structure of cyclic molecules containing C=C bonds. Benzene is the only planar aromatic structure: all other molecules have only sp3 >CH2 and/or sp2 cis olefinic H>C=C<H groups. |
| In the text | |
|
Fig. 4 5–15 μm spectrum of the same species, and in the same proportions, as in Fig. 1. The vertical long-dashed black lines indicate the band centres of the interstellar emission bands. The short-dashed (shaded area) and solid green lines show the a-C(:H) modes (range) assigned to CH and CC bonds, respectively (e.g. Dartois et al. 2005; Pino et al. 2008; Robertson 1986). |
| In the text | |
|
Fig. 5 2D examples (thin lines) of fully conjugated 3D systems (thick lines, with the dotted bonds and arrowed or shadowed bonds connected), which exhibit only cis −HC=CH− aromatic CH and >C= functional groups; the latter are sp2 C atoms bonded to three other C atoms. |
| In the text | |
Current usage metrics show cumulative count of Article Views (full-text article views including HTML views, PDF and ePub downloads, according to the available data) and Abstracts Views on Vision4Press platform.
Data correspond to usage on the plateform after 2015. The current usage metrics is available 48-96 hours after online publication and is updated daily on week days.
Initial download of the metrics may take a while.