Fig. 7
Download original image
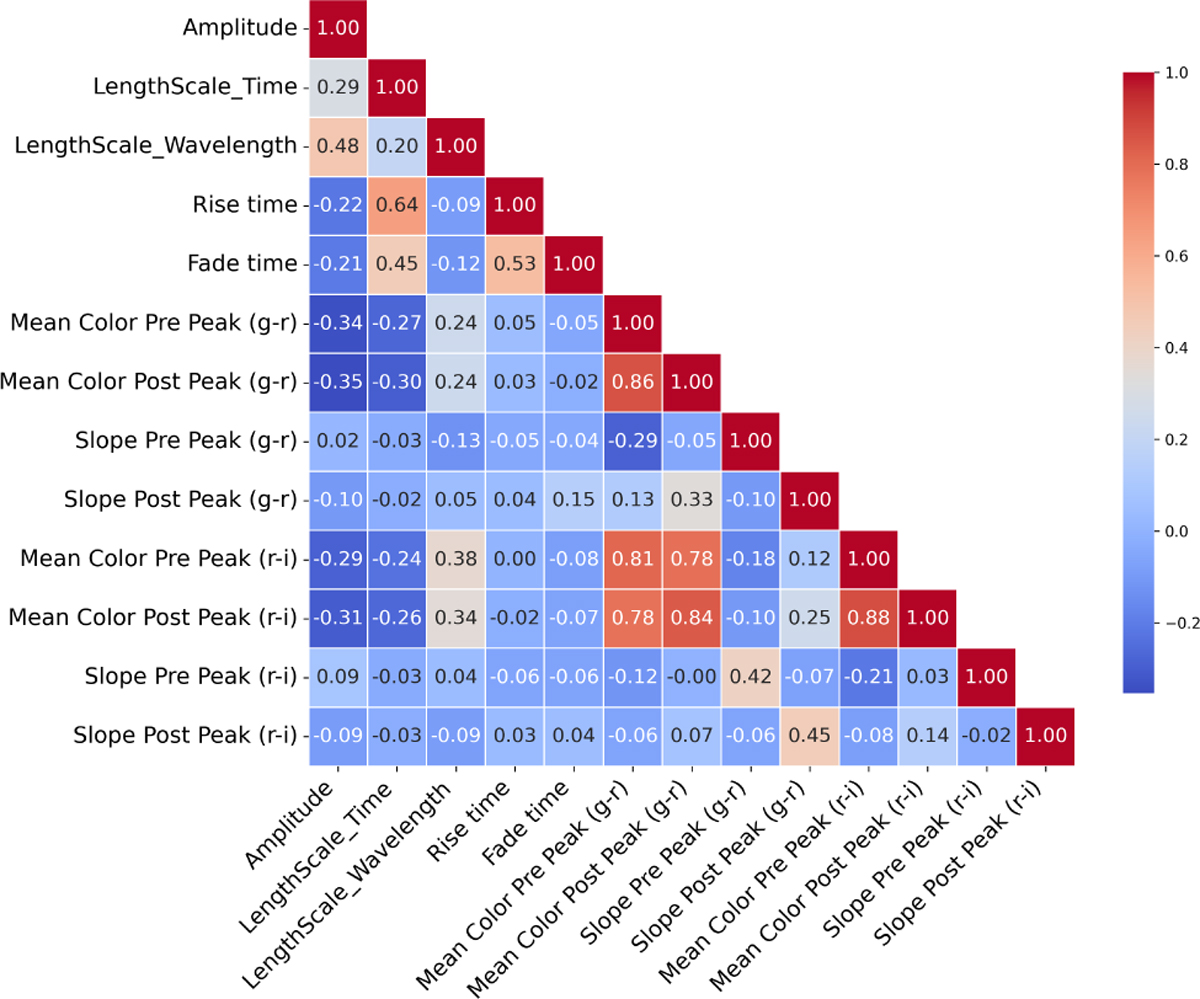
Correlation matrix of the selected features, indicating pairwise Spearman or Pearson correlation coefficients. Warmer colors correspond to higher positive correlations, while cooler colors indicate negative correlations. Notably, Mean_Color_Post_Peak_gr and Mean_Color_Post_Peak_ri show a strong positive correlation, reflecting common color-evolution behavior in TDEs.
Current usage metrics show cumulative count of Article Views (full-text article views including HTML views, PDF and ePub downloads, according to the available data) and Abstracts Views on Vision4Press platform.
Data correspond to usage on the plateform after 2015. The current usage metrics is available 48-96 hours after online publication and is updated daily on week days.
Initial download of the metrics may take a while.