| Issue |
A&A
Volume 703, November 2025
|
|
|---|---|---|
| Article Number | L5 | |
| Number of page(s) | 4 | |
| Section | Letters to the Editor | |
| DOI | https://doi.org/10.1051/0004-6361/202556899 | |
| Published online | 31 October 2025 | |
Letter to the Editor
Magnetic fields in planetary nebulae detected through non-thermal radio continuum emission
1
Department of Geodesy, Faculty of Geoengineering, University of Warmia and Mazury, ul. Oczapowskiego 2, 10-719 Olsztyn, Poland
2
Leiden Observatory, Leiden University, PO Box 9513 2300 RA Leiden, The Netherlands
3
ASTRON, The Netherlands Institute for Radio Astronomy, Postbus 2, NL-7990 AA Dwingeloo, The Netherlands
4
School of Physical Sciences, The Open University, Walton Hall, Milton Keynes MK7 6AA, UK
5
RAL Space, STFC Rutherford Appleton Laboratory, Chilton, Didcot, Oxfordshire OX11 0QX, UK
6
Department of Astrophysics/IMAPP, Radboud University, PO Box 9010 6500 GL Nijmegen, The Netherlands
7
Instituto de Radioastronomía y Astrofísica, Universidad Nacional Autónoma de México, Morelia, 58089 Mich., Mexico
8
Ruhr University Bochum, Faculty of Physics and Astronomy, Astronomical Institute (AIRUB), 44780 Bochum, Germany
⋆ Corresponding author: This email address is being protected from spambots. You need JavaScript enabled to view it.
Received:
18
August
2025
Accepted:
15
October
2025
Abstract
Context. Planetary nebulae are shells that have been ejected by low- and intermediate-mass stars. The slow wind ejected by an asymptotic giant branch star is compressed by a fast stellar wind to produce an expanding gaseous shell surrounding a hot bubble. The shell is a source of thermal radio emission, which displays a spectral index between −0.1 and 2. Only two planetary nebulae have been known to show non-thermal radio emission, which would indicate magnetic fields and non-thermal electrons.
Aims. The aim of this paper is to verify the presence of magnetic fields of planetary nebulae, based on the knowledge that magnetic fields can play a key role in shaping planetary nebulae.
Methods. We observed a sample of northern planetary nebulae in radio continuum at 144 MHz with the Low Frequency Array. We combined our observations with archival observations at higher frequencies.
Results. The spectral indices in 30 planetary nebulae were below −0.1, indicating non-thermal radio emission. The majority of this sample consists of bipolar planetary nebulae, which are known to originate from binary central stars. Most of the nebulae are characterised by sizes of more than 20 arcseconds in diameter. Magnetic fields and non-thermal emission may be common in smaller planetary nebulae, but it could be suppressed by the presence of thermal emission. Our results suggest that a range of different mechanisms can be responsible for the origin of magnetic fields and non-thermal emission in planetary nebulae.
Key words: stars: AGB and post-AGB / HII regions / planetary nebulae: general
© The Authors 2025
 Open Access article, published by EDP Sciences, under the terms of the Creative Commons Attribution License (https://creativecommons.org/licenses/by/4.0), which permits unrestricted use, distribution, and reproduction in any medium, provided the original work is properly cited.
This article is published in open access under the Subscribe to Open model. This email address is being protected from spambots. You need JavaScript enabled to view it. to support open access publication.
1. Introduction
The formation and evolution of planetary nebulae (PNe) is tightly correlated to the dramatic changes experienced by their progenitor low- and intermediate-mass stars. When the star evolves into the asymptotic giant branch (AGB) phase, it exhibits a dense, but slow wind (Ṁ ≲ 10−5 M⊙ yr−1, v ≈ 15 km s−1; Herwig 2005). After a few 105 years, the star can deposit up to 90% of its initial mass into the interstellar medium, forming a dense, dust-rich shell. As a result of the powerful mass loss, the hot core of the star is exposed, becoming a post-AGB star. The new hot star then produces a strong UV flux and a fast wind (≈500–4000 km s−1; Guerrero & De Marco 2013), which collectively compress and ionise the previously ejected material, ultimately forming a PN (Kwok 2000).
PNe emit across a broad range of electromagnetic spectrum, from X-rays to radio wavelengths. Each wavelength range provides complementary information about the structure and evolution of PNe. In radio frequencies, the free-free thermal emission dominates at GHz frequencies and it provides information on the ionised content of PNe, complementary to emission lines in optical and UV. Optically thin radio flux depends on the emission measure and has a spectral index of −0.1. Optically thick emission depends on the electron temperature and produces a spectral index of +2.0. Partially optically thick plasma produces a spectral index between −0.1 and 2. The spectral index below −0.1 indicates non-thermal emission, or a mixture of thermal and non-thermal emission (Hajduk et al. 2018).
Non-thermal radio emission is a signature of magnetic fields and energetic electrons. Non-thermal emission arising from wind-shock interactions was observed in a few proto-PNe (Bains et al. 2009), but was pursued unsuccessfully in PNe since the 1960s until Suárez et al. (2015) found non-thermal emission in IRAS 15103–5754. A few years later, Hajduk et al. (2024) reported non-thermal emission in a born-again PN Sakurai’s Object at cm wavelengths. Cerrigone et al. (2017) listed a few more candidates that might be characterised by non-thermal emission.
Magnetic fields can play an important role in shaping planetary nebulae (Blackman et al. 2001). It has been suggested that magnetic fields are a necessary ingredient in the common envelope scenario, which is responsible for the formation of bipolar PNe (García-Díaz et al. 2012). The lack of radio continuum non-thermal emission from PNe could indicate that magnetic fields do not exist in the majority of PNe and synchrotron emission is too faint compared to thermal emission or it is embedded in optically thick thermal emission (Hajduk et al. 2018). The optical depth of thermal emission increases with ν−2, which could make the detection of synchrotron emission problematic at low frequencies. In addition, non-thermal emission has not yet been observed at low frequencies (Hajduk et al. 2021; Asher et al. 2025).
Good spatial resolution and sensitivity could help us to observe non-thermal emission at low frequencies (Dgani & Soker 1998). In this paper, we report the detection of synchrotron emission in a sample of PNe using Low-Frequency Array (LOFAR; van Haarlem et al. 2013).
2. Identification of planetary nebulae at 144 MHz
LOFAR is the first interferometer operating in the MHz regime on very long baselines, including 54 stations distributed over Europe. Each station can operate independently or within the International LOFAR Telescope (ILT) network with high-band antennas (HBAs) observing at 120–240 MHz or low-band antennas (LBAs) observing at 10–90 MHz.
One of the key projects in the field is the LOFAR Two-metre Sky Survey (LoTSS; Shimwell et al. 2022). Radio maps at 128–160 MHz (average frequency of 144 MHz) have been restored with a 6 arcsec beam. The spatial resolution and average sensitivity of 100 μJy are much deeper than previous surveys in this spectral range. We used LOFAR Data Release 3 (DR 3) observations, which cover about 80% of the northern sky.
We selected 600 true, possible, and likely PNe within the LOFAR DR3 fields using The University of Hong Kong/Australian Astronomical Observatory/Strasbourg Observatory H-alpha Planetary Nebula (HASH PN) database of Galactic planetary nebulae (Parker et al. 2016). For relatively compact and coincident sources, the cross-matching between LOFAR and optical images would be relatively straightforward (Williams et al. 2019). However, we were not able to employ classical methods for positional matching in our case because most of the objects are extended and their positional precision is not well defined; in addition, the surface brightness distribution can be different in Hα and at 144 MHz.
HASH positions are measured from aperture and centroid fitting of Hα emission (Parker et al. 2016). The positional accuracy is not given. The sources are detected in LOFAR-DR3 images with the Python Blob Detection and Source Finder (PyBDSF; Mohan & Rafferty 2015) and fitted with a Gaussian. The positional accuracy ranges from about 0.2 arcsec to 0.5 arcsec, respectively, for sources with a high and low signal-to-noise ratio (S/N). The positional accuracy is worse for extended sources.
For optically thin thermal emission at 144 MHz, the brightness distribution reflects primarily emission measure in different directions, similarly to Hα. The surface brightness distribution of a nebula optically thick at 144 MHz depends on Te and it would be flat for a PN with homogeneous electron temperature. The regions where magnetic fields and shocks producing non-thermal electrons exist may be the source of non-thermal radio emission, whose brightness distribution might be significantly different from Hα emission.
We cross-matched the positions of PNe with the positions of radio sources in the LOFAR-DR3 source catalog. The initial matching radius was 60 arcsec. It resulted in 257 matches. The histogram of source separations reveals a maximum corresponding to a separation of about 2 arcsec with a tail resulting from variable position precision (Callingham et al. 2019) and some background objects (Fig. 1). The separation of the source counterparts can be larger in the case of different surface brightness distribution in Hα and 144 MHz. Adopting the mean positional accuracy of PNe of 2 arcsec, corresponding roughly to the width of the peak in the histogram, we would expect to obtain less than one false positive (i.e., background object appearing closer than 2 arcsec to a PN) across the whole sample.
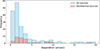 |
Fig. 1. Separations of the PNe and LoTSS DR3 sources. |
We combined LoTSS data with observations at higher frequencies (Zijlstra et al. 1989; Gregory & Condon 1991; Gregory et al. 1996; Rengelink et al. 1997; Condon et al. 1998; Perrott et al. 2015; Gordon et al. 2021; Hale et al. 2021; Duchesne et al. 2025 to derive the spectral indices and determine the radio emission mechanism. We used both interferometric surveys and single-dish surveys to improve frequency coverage. Hajduk et al. (2018) showed good agreement between flux densities of the same PNe measured using single-dish antennas and interferometers. However, single-dish observations are more vulnerable to blending with background objects due to worse angular resolution. We inspected radio maps and removed single dish measurements blended with background sources.
The fluxes of the objects can be affected by the limited sensitivity of the interferometer to extended emission. This can occur in interferometers with a limited number of short baselines. LOFAR has a dense core that enables us to observe large structures extending to a few degrees in the sky. However, we removed data points where the source size exceeded the largest angular scale for the VLASS survey (53 arcsec).
We calculated spectral indices with a linear fit to all data points (Figs. A2, A3, and A4). The non-thermal sources, with spectral indices < − 0.1, are plotted with red bars in the histogram in Fig. 1 and the remaining sources are plotted with blue bars. The distribution of non-thermal sources shows a maximum, which would not be expected in the case of a random distribution. Thus, at least some of the non-thermal sources must be real counterparts of the PNe. We inspected each case individually to remove the remaining background galaxies. We assumed the cases where a compact radio source was located within an extended PN, but without any link to the PN morphology to be a background object. We identified 30 PNe displaying non-thermal radio emission. Their properties are listed in Table A1. We did not include objects that did not have counterparts in other radio surveys, so that we could not verify their emission mechanism.
3. Non-thermal emission in PNe
Non-thermal emission and magnetic fields in PNe may be generated with a few different mechanisms. Bipolar non-thermal emission can be explained by winds from magnetised central stars (Chevalier & Luo 1994). In such cases, the synchrotron emission is concentrated towards the polar axis of the central star.
The intersection of hot bubbles with the slower shell can raise shocks with temperatures reaching 1 − 3 MK (Kastner et al. 2000) in which non-thermal electrons are produced. Magnetic fields can be amplified in the shocked hot bubble (Chevalier & Luo 1994). Radio non-thermal emission may originate from the interaction of a magnetised and fast wind with dense knots in the PN (Dgani & Soker 1998; Casassus et al. 2007). This can produce a patchy emission, which may be observed if radio images have sufficient angular resolution.
An important clue in determining the origin of non-thermal radio emission is the surface brightness distribution of radio continuum emission, along with the comparison of the optical and radio images. We plot the non-thermal 144 MHz emission and Hα emission for a few representative cases in Fig. 2. The Hα and 144 MHz emission for all PNe showing non-thermal emission is plotted in Figs. A4, A5, A6, and A7.
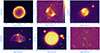 |
Fig. 2. Examples of 144 MHz radio (contours) and optical (background) emission: Abell 53, IRAS 19086+0603, KLSS 2–7, M 1–79, NGC 6826, and PaEk 1. The beam size is indicated by a circle in the bottom-left corner. |
In several cases, non-thermal radio emission in PNe fills low surface-brightness regions in Hα. This could be the case for NGC 6781 and NGC 6894 (Fig. A6). The 144 MHz sizes of these PNe are smaller than optical sizes. Their optical images show bipolar and elliptical morphology. It is not clear whether radio emission fills all the volume of the hot bubble or whether it exists on the boundary of the hot bubble with the dense shell.
A few sources clearly show bipolar radio emission: Abell 53, AGP 2, Kn 7, M 1–79, and PaEk 1. Four of these PNe are classified in Hα as bipolar by Parker et al. (2016). Abell 53 is classified as a round PN. Their emission could trace the bipolar stellar outflow.
Finally, some of the PNe reveal patchy emission, for instance, Abell 3, KK 26, Kn 43. These could be produced with the third mechanism discussed, the interaction of the wind with dense knots. Non-thermal PNe are relatively large in size. Most of them are larger than 20 arcsec across (Fig. 3), which could be the result of observational selection. Another reason could be that smaller PNe are optically thick and non-thermal emission might be suppressed by an optically thick outer shell. Another reason is that in sources unresolved by LOFAR we cannot resolve non-thermal and thermal components spatially. Radio spectra may be dominated by the thermal component, but it does not exclude the contribution of non-thermal emission.
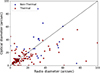 |
Fig. 3. Sizes of PNe dominated by thermal and non-thermal emission. |
Most of PNe showing non-thermal emission are classified as bipolar (56% compared to 35% in thermally emitting sample) and only a few have elliptical shapes (17% compared to 41%). Figure 4 shows the distribution of shapes for non-thermal and thermal sources with diameters ≥20 arcsec. However, in some cases, the morphological type assigned to a PN in optical may be erroneous if the classification is based on the projected surface brightness distribution. For the morphology determination, a spatio-kinematical reconstruction is necessary in some cases. The de-projected structure of the observed radio emission is also not known.
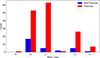 |
Fig. 4. Morphology of PNe dominated by thermal and non-thermal emission. R – round, B – bipolar, E – elliptical, and I – irregular. |
The spectral indices of most PNe cover the range −0.1 and −0.7, with two cases having values of −1 (Fig. 5). The spectral index of non-thermal emission depends on the distribution of electron energies. In that case, Ne = KE−ρdE where Ne is a number of electrons per unit volume. Taking into account that  radio spectra would indicate different electron distributions; for instance, ρ = 2.4 for the spectral index of −0.7 and ρ = 1.8 for the spectral index of −0.4. However, the observed spectral index may be affected by contribution from thermal emission in cases where radio observations cover a narrow range of frequencies.
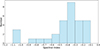 |
Fig. 5. Spectral indices of the non-thermal emission in PNe. |
So far, magnetic fields have been observed in a small sample of PNe. Greaves (2002) discovered magnetic fields in NGC 7027 and Gómez et al. (2009) did discovered them in PN K 3–35. Sabin et al. (2007) discovered toroidal fields in four PNe trace polarisation of the dust. Non-thermal radio emission in IRAS 15103-5754 (Suárez et al. 2015) and Sakurai’s Object (Hajduk et al. 2024) are linked to mass-loss processes and wind interactions. In H II regions, which closely resemble PNe, non-thermal emission originates from the regions where electrons are accelerated in shocks (Padovani et al. 2019).
4. Summary
New low-frequency observations have largely increased the number of PNe with observed non-thermal emission and magnetic fields. We are not yet able to propose one common mechanism to explain the non-thermal emission in all the observed PNe. However, we do observe that non-thermal emission is more frequently observed in bipolar PNe, which indicates that the mechanism that produces bipolar PNe would also be responsible for formation of magnetic fields. The detected magnetic fields might be (circum-)stellar magnetic fields dragged out by the winds. Bipolar PNe produced in a binary interaction are more likely to possess structures such as low-ionisation knots or filaments that may interact with the stellar wind (Miszalski et al. 2009).
Data availability
The figures and fluxes of the 30 PNe are available at this link. The source catalogue and images will be included in the official release of the LoTSS DR3 catalogue (Shimwell et al., in prep.).
Acknowledgments
RJD acknowledges support by the BMFTR ErUM-Pro program. We acknowledge Harish Vedantham for his comments on the manuscript. This research has made use of “Aladin sky atlas” developed at CDS, Strasbourg Observatory, France.
References
- Asher, A. D., Smeaton, Z. J., Filipović, M. D., et al. 2025, PASA, 42, 111 [Google Scholar]
- Bains, I., Cohen, M., Chapman, J. M., Deacon, R. M., & Redman, M. P. 2009, MNRAS, 397, 1386 [CrossRef] [Google Scholar]
- Blackman, E. G., Frank, A., Markiel, J. A., Thomas, J. H., & Van Horn, H. M. 2001, Nature, 409, 485 [Google Scholar]
- Callingham, J. R., Vedantham, H. K., Pope, B. J. S., Shimwell, T. W., & LoTSS Team 2019, Res. Notes Am. Astron. Soc., 3, 37 [Google Scholar]
- Casassus, S., Nyman, L. Å., Dickinson, C., & Pearson, T. J. 2007, MNRAS, 382, 1607 [NASA ADS] [CrossRef] [Google Scholar]
- Cerrigone, L., Umana, G., Trigilio, C., et al. 2017, MNRAS, 468, 3450 [CrossRef] [Google Scholar]
- Chevalier, R. A., & Luo, D. 1994, ApJ, 421, 225 [NASA ADS] [CrossRef] [Google Scholar]
- Condon, J. J., Cotton, W. D., Greisen, E. W., et al. 1998, AJ, 115, 1693 [Google Scholar]
- Dgani, R., & Soker, N. 1998, ApJ, 499, L83 [Google Scholar]
- Duchesne, S., Ross, K., Thomson, A. J. M., et al. 2025, PASA, 42, 38 [Google Scholar]
- García-Díaz, M. T., López, J. A., Steffen, W., & Richer, M. G. 2012, ApJ, 761, 172 [CrossRef] [Google Scholar]
- Gómez, Y., Tafoya, D., Anglada, G., et al. 2009, ApJ, 695, 930 [Google Scholar]
- Gordon, Y. A., Boyce, M. M., O’Dea, C. P., et al. 2021, ApJS, 255, 30 [NASA ADS] [CrossRef] [Google Scholar]
- Greaves, J. S. 2002, A&A, 392, L1 [NASA ADS] [CrossRef] [EDP Sciences] [Google Scholar]
- Gregory, P. C., & Condon, J. J. 1991, ApJS, 75, 1011 [Google Scholar]
- Gregory, P. C., Scott, W. K., Douglas, K., & Condon, J. J. 1996, ApJS, 103, 427 [NASA ADS] [CrossRef] [Google Scholar]
- Guerrero, M. A., & De Marco, O. 2013, A&A, 553, A126 [NASA ADS] [CrossRef] [EDP Sciences] [Google Scholar]
- Hajduk, M., van Hoof, P. A. M., Śniadkowska, K., et al. 2018, MNRAS, 479, 5657 [NASA ADS] [CrossRef] [Google Scholar]
- Hajduk, M., Haverkorn, M., Shimwell, T., et al. 2021, ApJ, 919, 121 [Google Scholar]
- Hajduk, M., van Hoof, P. A. M., Zijlstra, A. A., et al. 2024, A&A, 688, L21 [NASA ADS] [CrossRef] [EDP Sciences] [Google Scholar]
- Hale, C. L., McConnell, D., Thomson, A. J. M., et al. 2021, PASA, 38, e058 [NASA ADS] [CrossRef] [Google Scholar]
- Herwig, F. 2005, ARA&A, 43, 435 [NASA ADS] [CrossRef] [Google Scholar]
- Kastner, J. H., Soker, N., Vrtilek, S. D., & Dgani, R. 2000, ApJ, 545, L57 [Google Scholar]
- Kwok, S. 2000, The Origin and Evolution of Planetary Nebulae (Cambridge University Press) [Google Scholar]
- Miszalski, B., Acker, A., Parker, Q. A., & Moffat, A. F. J. 2009, A&A, 505, 249 [NASA ADS] [CrossRef] [EDP Sciences] [Google Scholar]
- Mohan, N., & Rafferty, D. 2015, Astrophysics Source Code Library [record ascl:1502.007] [Google Scholar]
- Padovani, M., Marcowith, A., Sánchez-Monge, Á., Meng, F., & Schilke, P. 2019, A&A, 630, A72 [NASA ADS] [CrossRef] [EDP Sciences] [Google Scholar]
- Parker, Q. A., Bojičić, I. S., & Frew, D. J. 2016, J. Phys.: Conf. Ser., 728, 032008 [Google Scholar]
- Perrott, Y. C., Scaife, A. M. M., Green, D. A., et al. 2015, MNRAS, 453, 1396 [NASA ADS] [CrossRef] [Google Scholar]
- Rengelink, R. B., Tang, Y., de Bruyn, A. G., et al. 1997, A&AS, 124, 259 [NASA ADS] [CrossRef] [EDP Sciences] [Google Scholar]
- Sabin, L., Zijlstra, A. A., & Greaves, J. S. 2007, MNRAS, 376, 378 [Google Scholar]
- Shimwell, T. W., Hardcastle, M. J., Tasse, C., et al. 2022, A&A, 659, A1 [NASA ADS] [CrossRef] [EDP Sciences] [Google Scholar]
- Suárez, O., Gómez, J. F., Bendjoya, P., et al. 2015, ApJ, 806, 105 [CrossRef] [Google Scholar]
- van Haarlem, M. P., Wise, M. W., Gunst, A. W., et al. 2013, A&A, 556, A2 [NASA ADS] [CrossRef] [EDP Sciences] [Google Scholar]
- Williams, W. L., Hardcastle, M. J., Best, P. N., et al. 2019, A&A, 622, A2 [NASA ADS] [CrossRef] [EDP Sciences] [Google Scholar]
- Zijlstra, A. A., Pottasch, S. R., & Bignell, C. 1989, A&AS, 79, 329 [NASA ADS] [Google Scholar]
All Figures
|
Fig. 1. Separations of the PNe and LoTSS DR3 sources. |
| In the text | |
|
Fig. 2. Examples of 144 MHz radio (contours) and optical (background) emission: Abell 53, IRAS 19086+0603, KLSS 2–7, M 1–79, NGC 6826, and PaEk 1. The beam size is indicated by a circle in the bottom-left corner. |
| In the text | |
|
Fig. 3. Sizes of PNe dominated by thermal and non-thermal emission. |
| In the text | |
|
Fig. 4. Morphology of PNe dominated by thermal and non-thermal emission. R – round, B – bipolar, E – elliptical, and I – irregular. |
| In the text | |
|
Fig. 5. Spectral indices of the non-thermal emission in PNe. |
| In the text | |
Current usage metrics show cumulative count of Article Views (full-text article views including HTML views, PDF and ePub downloads, according to the available data) and Abstracts Views on Vision4Press platform.
Data correspond to usage on the plateform after 2015. The current usage metrics is available 48-96 hours after online publication and is updated daily on week days.
Initial download of the metrics may take a while.