Fig. 12.
Download original image
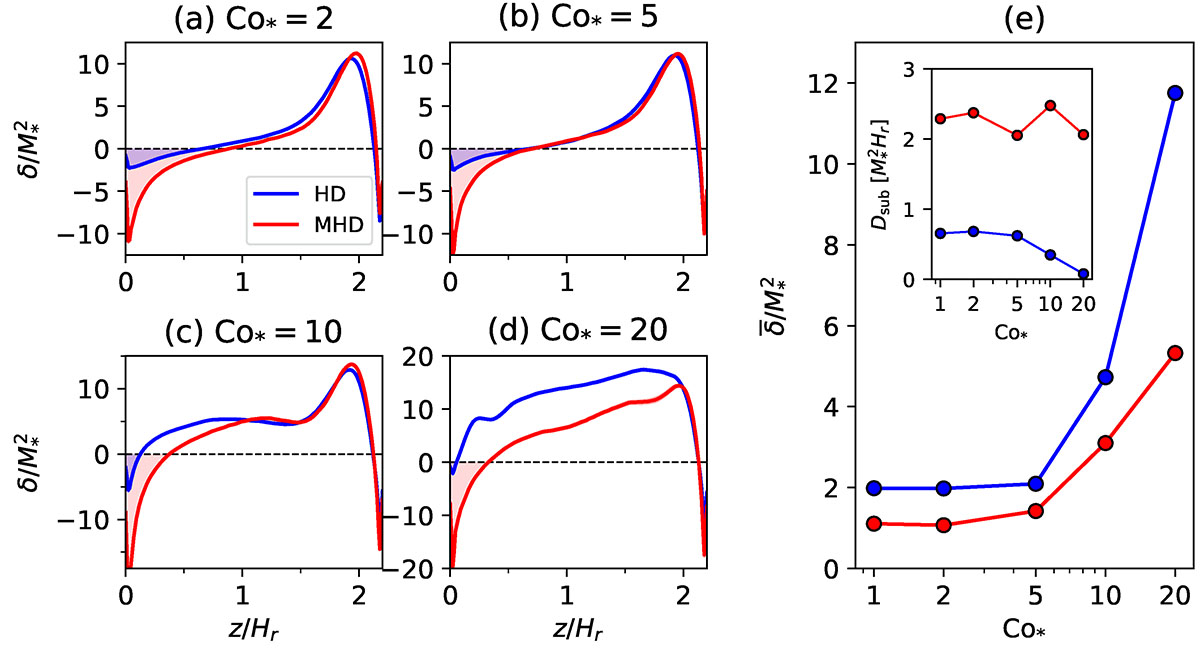
Profiles of the superadiabaticity, δ. (a–d) Vertical profiles of δ for different Co*. Blue and red curves represent the results from HD and MHD simulations. (e) Volume-averaged values of superadiabaticity, ![]() , as a function of Co*. The inset shows the magnitudes of the subadiabatic layers near the bottom of the convection zone, Dsub = ∫0dsub|δ|dz (with dsub being the height below which the mean stratification is subadiabatic), denoted by the shaded areas in panels a–d.
, as a function of Co*. The inset shows the magnitudes of the subadiabatic layers near the bottom of the convection zone, Dsub = ∫0dsub|δ|dz (with dsub being the height below which the mean stratification is subadiabatic), denoted by the shaded areas in panels a–d.
Current usage metrics show cumulative count of Article Views (full-text article views including HTML views, PDF and ePub downloads, according to the available data) and Abstracts Views on Vision4Press platform.
Data correspond to usage on the plateform after 2015. The current usage metrics is available 48-96 hours after online publication and is updated daily on week days.
Initial download of the metrics may take a while.