Fig. 14.
Download original image
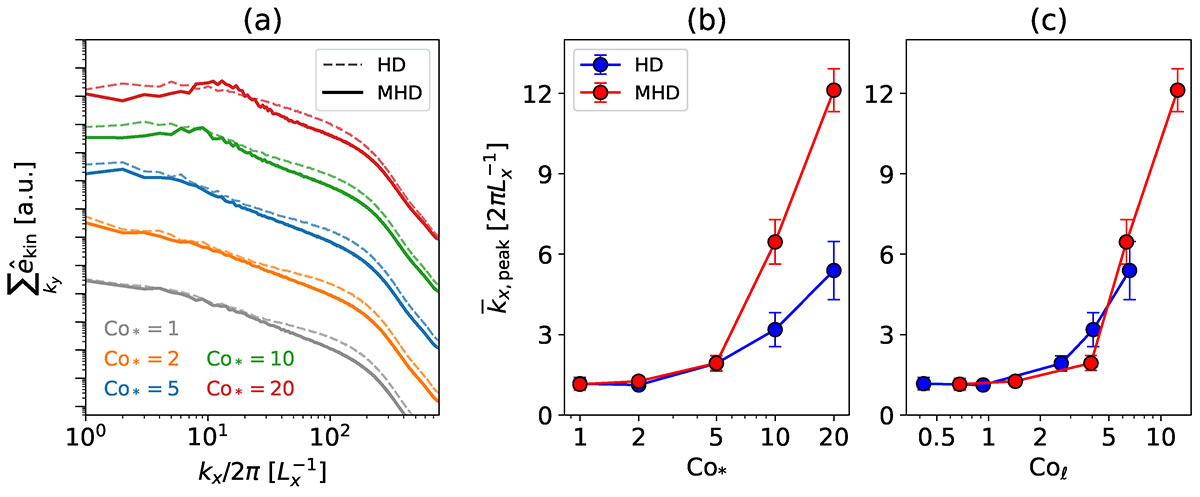
(a) Normalized kinetic energy spectra, ![]() , in the middle convection zone (z = 1.1 Hr). Different colors represent different Co*. Dashed and solid lines show the results from HD and MHD simulations, respectively. (b) Longitudinal wavenumbers where the kinetic energy spectra peak,
, in the middle convection zone (z = 1.1 Hr). Different colors represent different Co*. Dashed and solid lines show the results from HD and MHD simulations, respectively. (b) Longitudinal wavenumbers where the kinetic energy spectra peak, ![]() , is plotted against the flux Coriolis number, Co*. The blue and red circles are the results for the HD and MHD cases. (c) Same as panel b but as a function of the dynamical Coriolis number, Co
, is plotted against the flux Coriolis number, Co*. The blue and red circles are the results for the HD and MHD cases. (c) Same as panel b but as a function of the dynamical Coriolis number, Co![]() .
.
Current usage metrics show cumulative count of Article Views (full-text article views including HTML views, PDF and ePub downloads, according to the available data) and Abstracts Views on Vision4Press platform.
Data correspond to usage on the plateform after 2015. The current usage metrics is available 48-96 hours after online publication and is updated daily on week days.
Initial download of the metrics may take a while.