Open Access
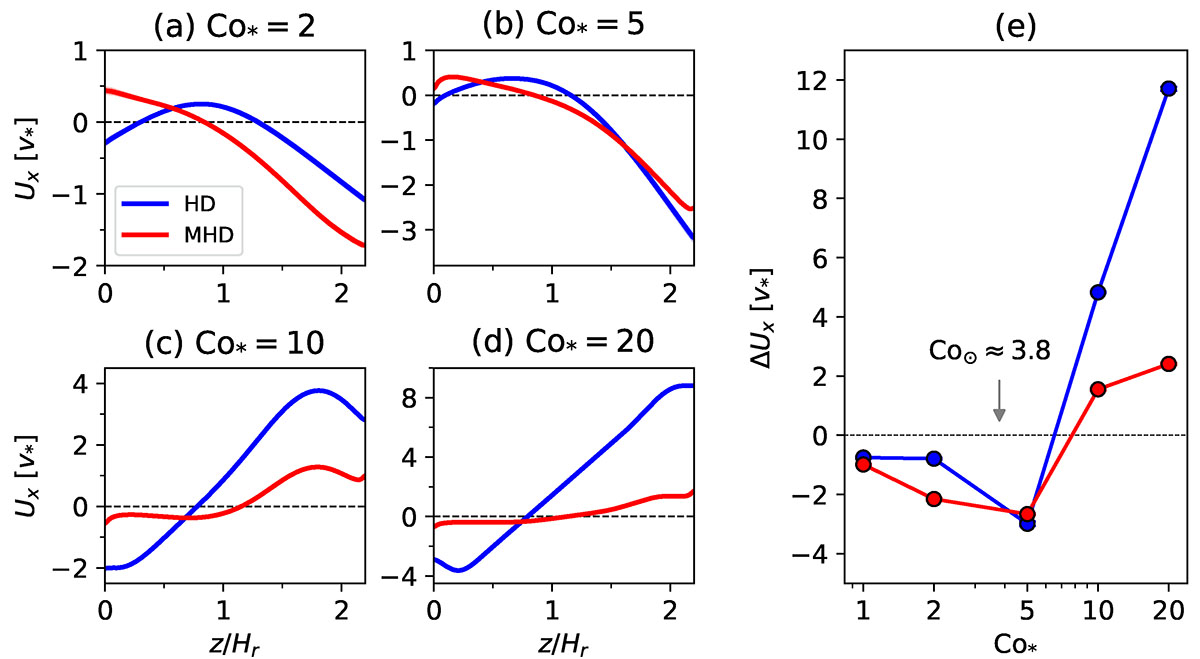
Fig. 15.
Download original image
Profiles of the mean flows, Ux(z). (a–d) Vertical profiles of Ux(z) for different Co*. Blue and red colors represent the results from the HD and MHD simulations. (e) Vertical shear amplitudes of the mean flow, ΔUx = Ux(zmax)−Ux(zmin), as a function of Co*.
Current usage metrics show cumulative count of Article Views (full-text article views including HTML views, PDF and ePub downloads, according to the available data) and Abstracts Views on Vision4Press platform.
Data correspond to usage on the plateform after 2015. The current usage metrics is available 48-96 hours after online publication and is updated daily on week days.
Initial download of the metrics may take a while.