Fig. 16.
Download original image
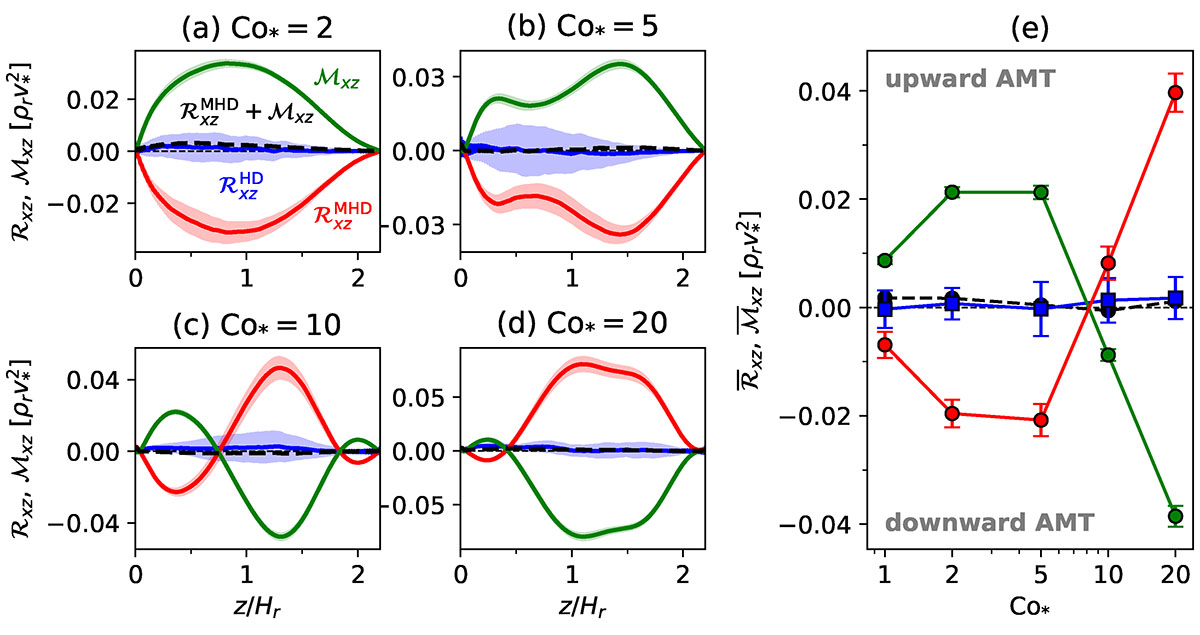
Profiles of the Reynolds and Maxwell stresses, defined by Eq. (44). Positive and negative values correspond to the upward and downward AMT. (a–d) Vertical profiles of the Reynolds stress, ℛxz, for different values of Co*. Blue and red colors represent the results from the HD and MHD cases. Green curves show the vertical profiles of the Maxwell stress, ℳxz, and the dashed black curves indicate the sum ℛxz + ℳxz in the MHD simulations. (e) Volume-averaged Reynolds and Maxwell stresses, ![]() and
and ![]() , plotted as functions of Co*.
, plotted as functions of Co*.
Current usage metrics show cumulative count of Article Views (full-text article views including HTML views, PDF and ePub downloads, according to the available data) and Abstracts Views on Vision4Press platform.
Data correspond to usage on the plateform after 2015. The current usage metrics is available 48-96 hours after online publication and is updated daily on week days.
Initial download of the metrics may take a while.